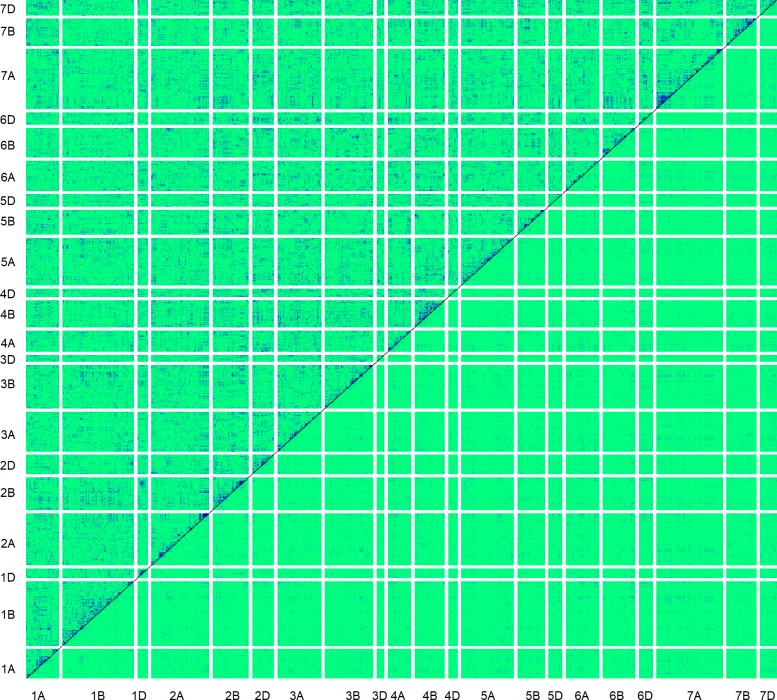
Fig 6. Heat map of LD (R2) among 790 SNP markers across the 21 chromosomes of wheat.
Light green colour indicates low R2 values whilst dark blue indicates high values. Data for observed genotypes are above the diagonal and genotypes simulated with gene dropping are below the diagonal. Markers are ordered according to position on the genetic map [20]. LD, linkage disequilibrium; SNP, single nucleotide polymorphism.

