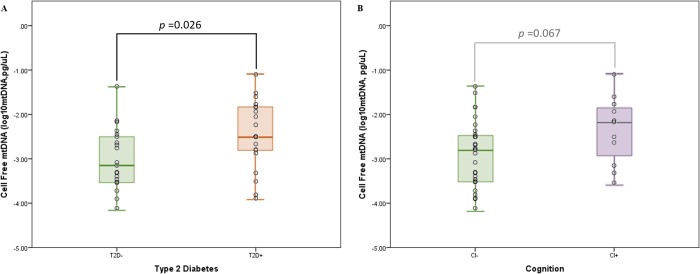
Fig 1. Average cell-free mitochondrial DNA levels stratified on diabetes and cognitive status.
(A) Cell-free levels appear to be higher in individuals with diabetes (t-test p-value, 0.026) and those with cognitive impairment (B) (t-test p-value = 0.067, insignificant). A larger effect was observed for diabetic individuals. Note, age is matched between the T2D stratified analysis, but is not matched in the CI stratified analysis (i.e., CI+ subjects are older than CI-).

