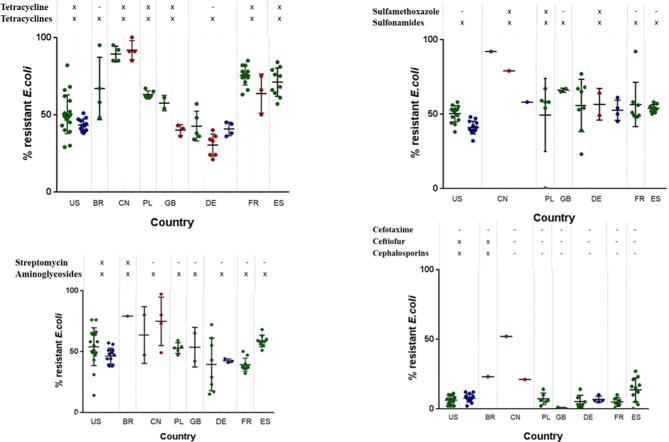
Figure 5.
Resistance rates in E. coli to antibiotics from healthy animals (green dots), chicken retail meat (blue dots), and diseased chickens (red dots) detected within scientific studies or national monitoring programs. Each dot represents 1 study or data set in 1 yr. On the top of the figure, status of approval for the specific antibiotic tested for resistance (first line), the antimicrobial class (second line).

