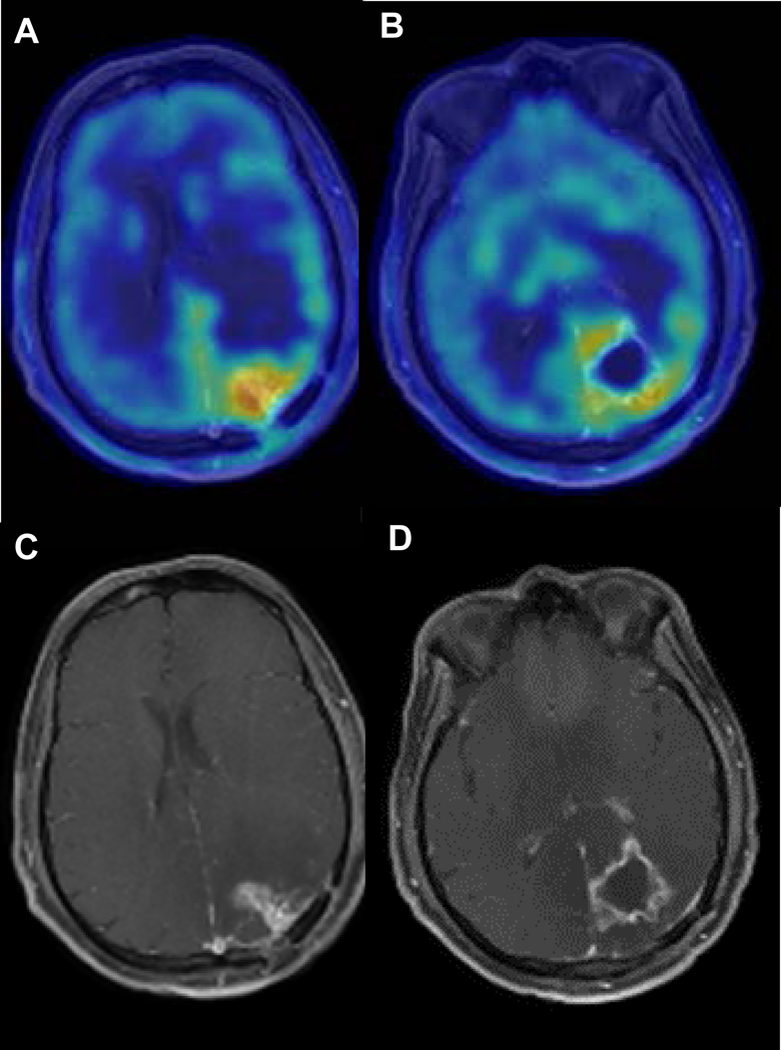
Figure 3.

Axial T1 post-contrast MRI and AMT-PET imaging for patient 3. Pretreatment imaging demonstrated AMT SUV ratios slightly above 1.65 in various tumor regions, consistent with active tumor and similar to baseline values seen in patient 1. No repeat AMT-PET was done due to rapid clinical progression during the first cycle of indoximod treatment.
