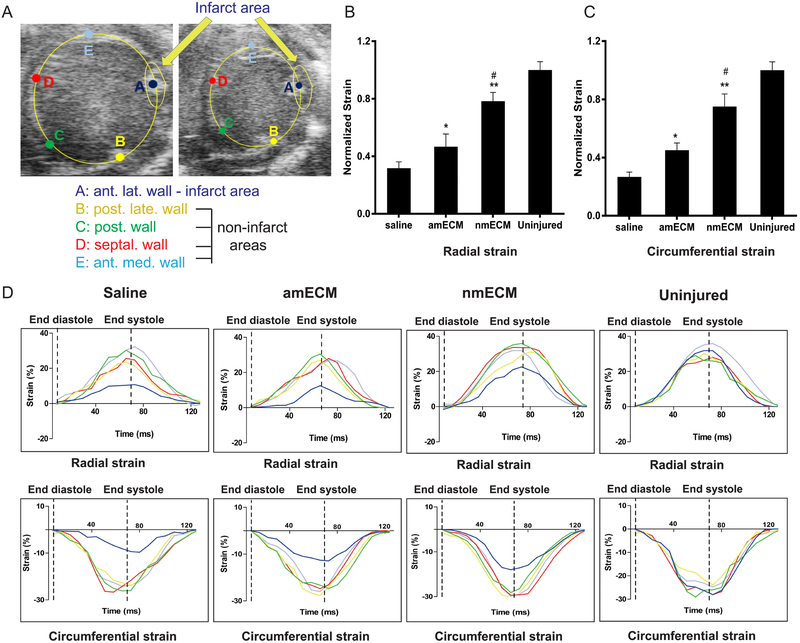
Figure 3. In vivo analysis of myocardial strain.
(A) Representative B-mode echocardiography images show the five regions of interest selected at diastole and systole for analysis of myocardial strain and consists of the infarct area and four uninjured areas to serve as internal controls of relative strain. Quantification of radial (B) and circumferential (C) strain show increased wall stiffness thickness in response to amECM, although this effect is further exacerbated in nmECM-treated mice. (D) Representative graphs of radial and circumferential strain are shown within the infarct area (navy) relative to the uninjured areas (yellow, green, red, light blue) in response to each treatment (n = 3 per treatment group; *p < 0.05, **p < 0.01 relative to saline; #p < 0.05 relative to amECM).

