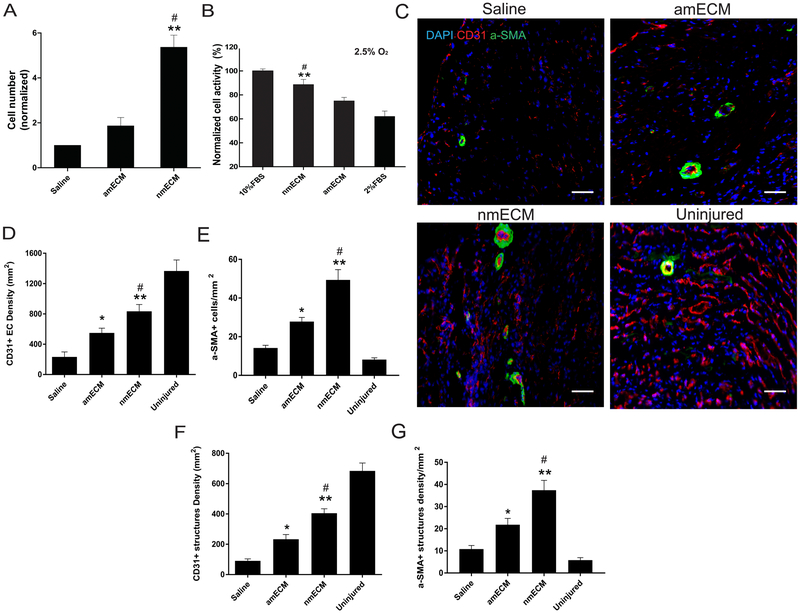
Figure 4. In vitro and in vivo stimulation of angiogenesis.
(A) In vitro HUVEC migration assays show significantly higher migration in response to nmECM than saline or amECM. (B) In oxygen-deprived (2.5% O2) and nutrient-deprived culture conditions, nmECM significantly preserves cell activity relative to amECM or 2% FBS control. (C) Representative images of CD31+ endothelial cells and surrounding αSMA+ smooth muscle cells reveal vasculature in uninjured hearts and in response to each treatment after MI (scale bar = 50μm). Quantification of CD31+ (D) and αSMA+ (E) cells reveal increased density of vascular cells in response to both amECM and nmECM, although nmECM produces significantly more than amECM-treated mice. The density of CD31+ blood vessels (F) and blood vessels surrounded by αSMA-expressing cells (G) showed a similar trend. (n = 4 per treatment group in all panels; *p < 0.05, **p < 0.01 relative to saline; #p < 0.05 relative to amECM).

