
Figure 3.
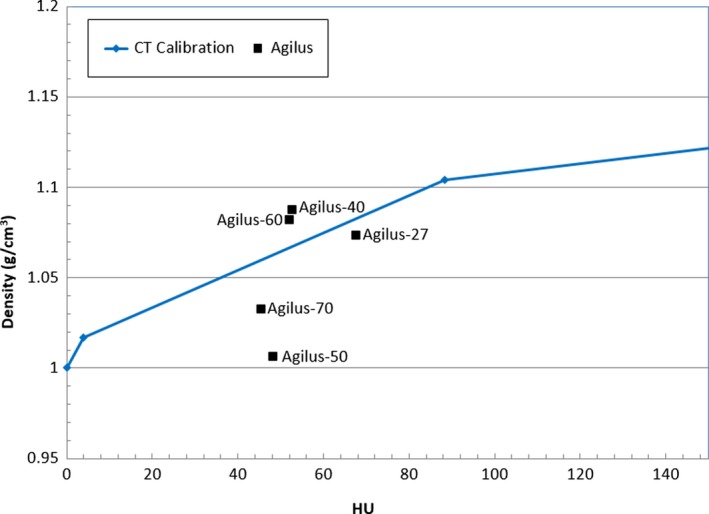
Measured density and CT calibration curve for the different Agilus compound test strips. The squares show the measured density and CT Hounsfield units (HU) for each compound. The line shows the CT calibration curve of the CT scanner used.
Official websites use .gov
A
.gov website belongs to an official
government organization in the United States.
Secure .gov websites use HTTPS
A lock (
) or https:// means you've safely
connected to the .gov website. Share sensitive
information only on official, secure websites.
Measured density and CT calibration curve for the different Agilus compound test strips. The squares show the measured density and CT Hounsfield units (HU) for each compound. The line shows the CT calibration curve of the CT scanner used.