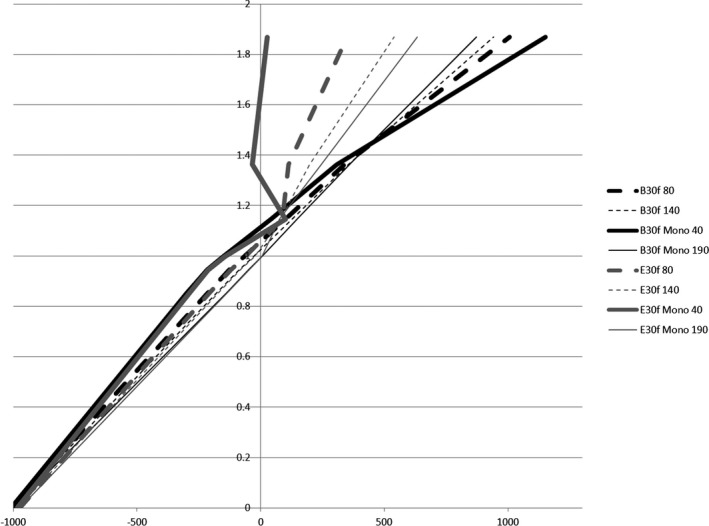
Figure 1.

CT‐Density curves for a high and low energy scan, 40 and 190 keV monoenergetic scans, all of which reconstructed with a FBP kernel (B30f) and a DD kernel (E30f).

CT‐Density curves for a high and low energy scan, 40 and 190 keV monoenergetic scans, all of which reconstructed with a FBP kernel (B30f) and a DD kernel (E30f).