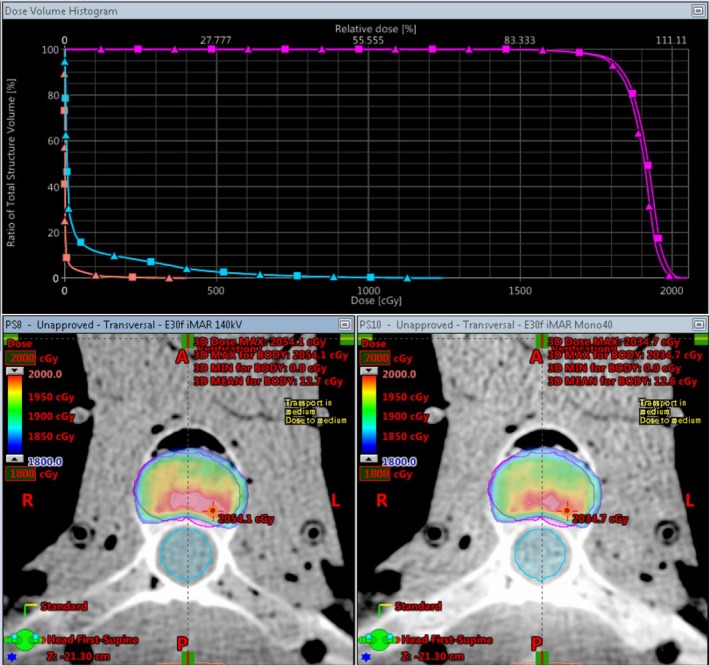
Figure 5.

Dose from an SBRT spine plan on Rando. The magenta contour is the PTV, the blue contour is the spine, and the peach contour is the skin. The view on the bottom left is the 140 kVp DD reconstruction and is represented on the graph by the square curves. The view on the bottom right is the 40 keV monoenergetic DD reconstruction and is represented on the graph by the triangle curves.
