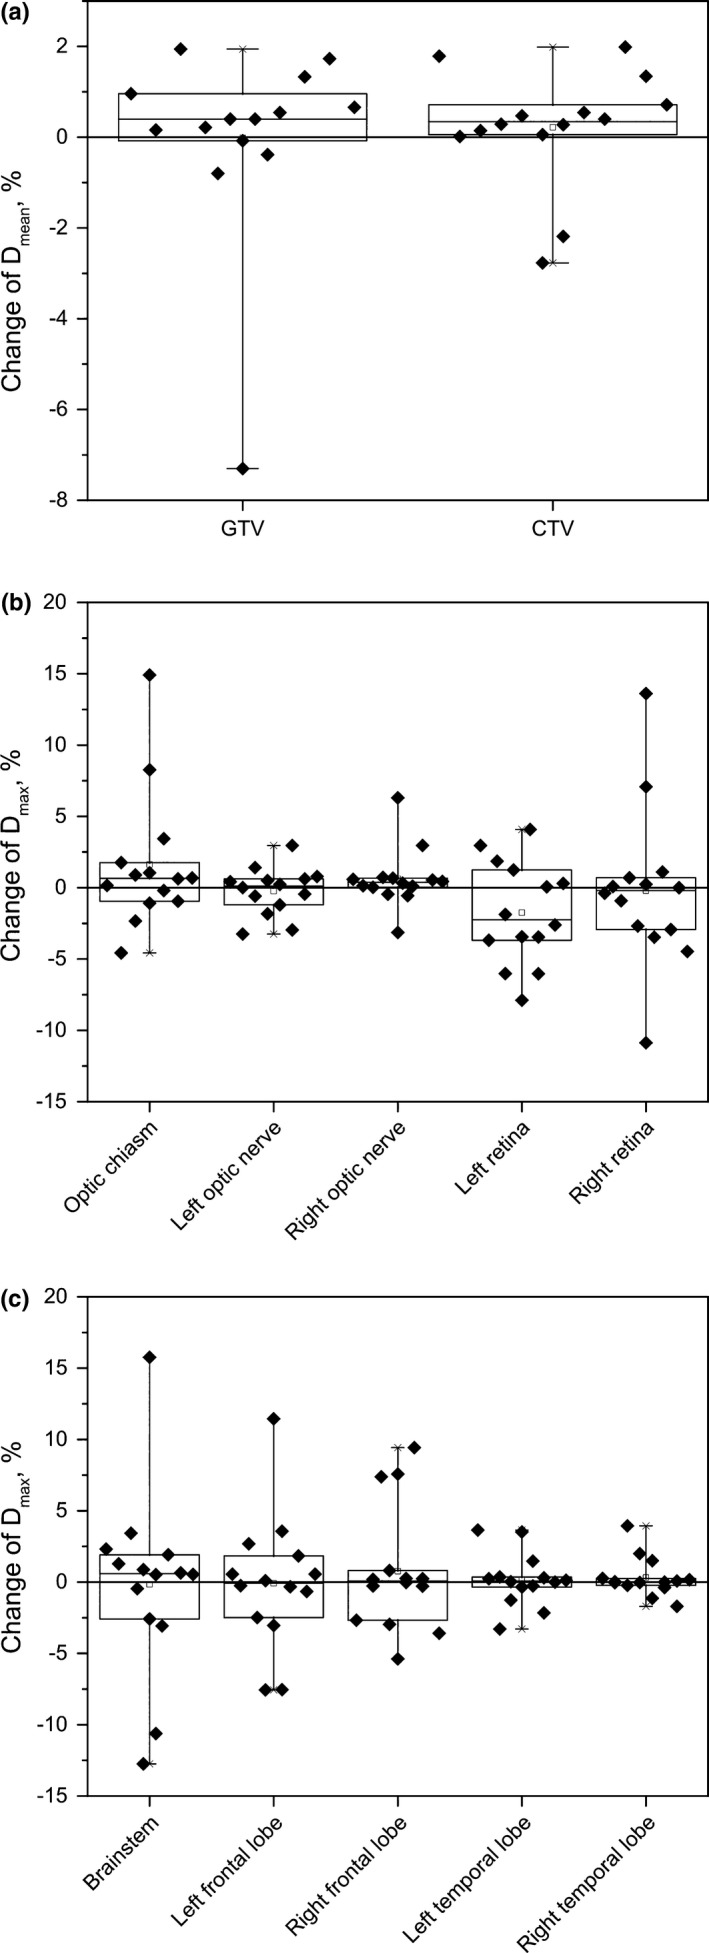
Figure 3.

Box plots of percentage difference of the doses calculated on planning and repeat CT; (a) for gross tumor volume (GTV) and CTV; (b) for optic structures; (c) for the brainstem and brain lobes. Shown in each plot are 25th and 75th percentile (box edges), the median (solid line within box) and most extreme values (whisker edges). The solid line on each panel indicates no change in dose.
