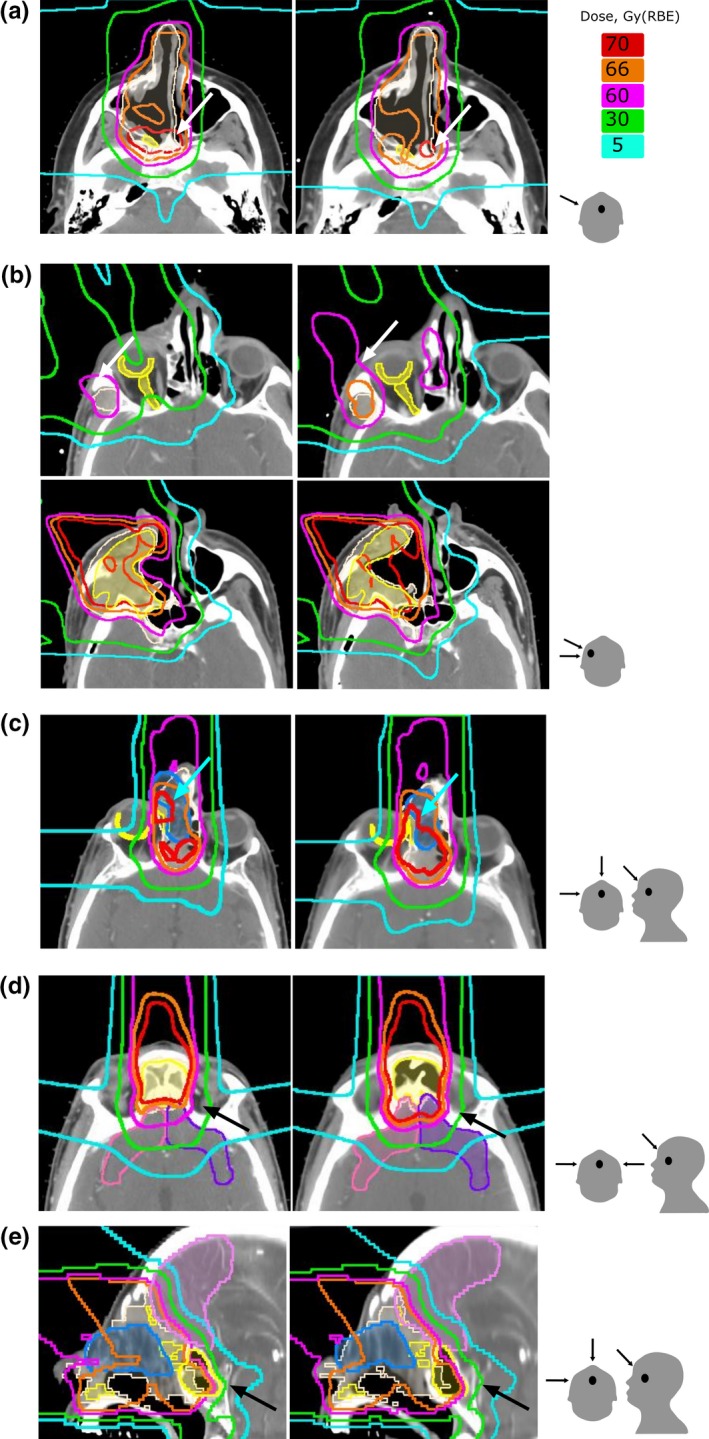
Figure 4.

Comparison of dose distributions calculated on planning CT (left) and repeat CT (right). gross tumor volume (GTV) and CTV are shown in shaded yellow and white color, respectively. Panel (a) shows aeration increase in the right maxillary sinus and a shift of the dose away from GTV (patient #12). Panel (b) (upper row) shows an increased dose to the right retina and optic nerve. Panel (b) (lower row) shows decrease in GTV and CTV coverage due to increase in soft tissue in the posterior wall of the right maxillary sinus (patient #5). Panel (c) shows increase in the dose to the right retina due to shrinkage of the surgical flap (patient #1). Panel (d) shows increase in the dose to the frontal lobes due to clearing of the bilateral frontal sinus (patient #14). Panel (e) shows increase in the dose to a frontal lobe due to fluid clearing in the sphenoid sinus and shrinkage of the surgical flap (patient #1). The last column demonstrates the direction of the boost fields.
