Figure 1.

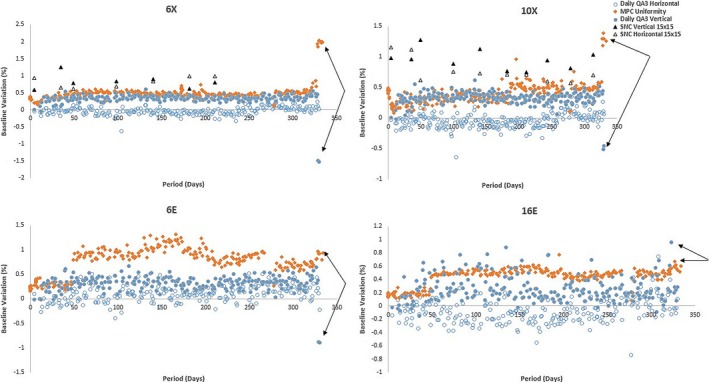
Baseline variation versus period: MPC, Daily QA 3 and SNC FS‐QA (photons only) symmetry and uniformity representation for machine E. Black arrows represent Daily QA 3 and MPC detection of induced beam symmetry adjustments.

Baseline variation versus period: MPC, Daily QA 3 and SNC FS‐QA (photons only) symmetry and uniformity representation for machine E. Black arrows represent Daily QA 3 and MPC detection of induced beam symmetry adjustments.