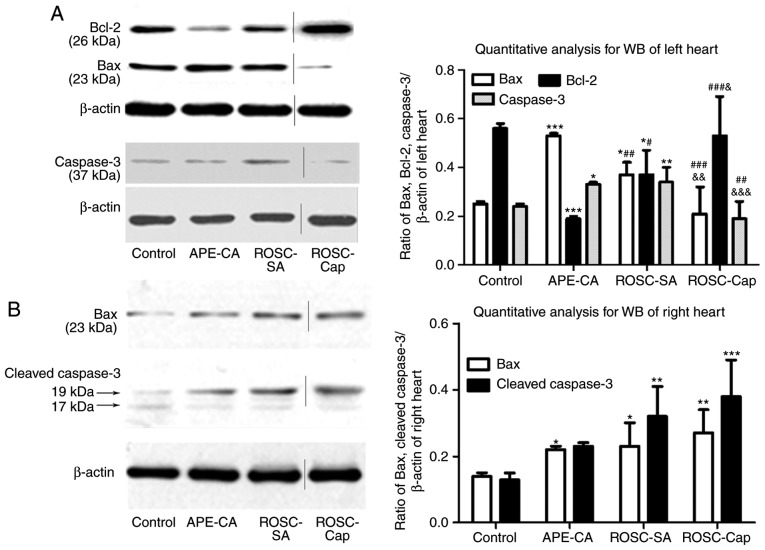
Figure 5.
Expression of apoptotic signaling proteins in the left and right heart as determined by WB. (A) Representative images and quantitative analysis of Bax, Bcl-2 and caspase-3 in the left heart. (B) Representative images and quantitative analysis of Bax and cleaved caspase-3 in the right heart. Vertical lines in the western blot indicate non-adjacent bands from the same gel. N=5 pigs per group. *P<0.05; **P<0.01; ***P<0.001 vs. the control group; #P<0.05; ##P<0.01; ###P<0.001 vs. the APE-CA group; &P<0.05; &&P<0.01; &&&P<0.001 vs. the ROSC-SA group. APE-CA, acute pulmonary embolism with cardiac arrest; ROSC, return of the spontaneous circulation; SA, saline; WB, western blot; Cap, captopril; Bcl-2, B-cell lymphoma 2; Bax, Bcl-2-associated X.

