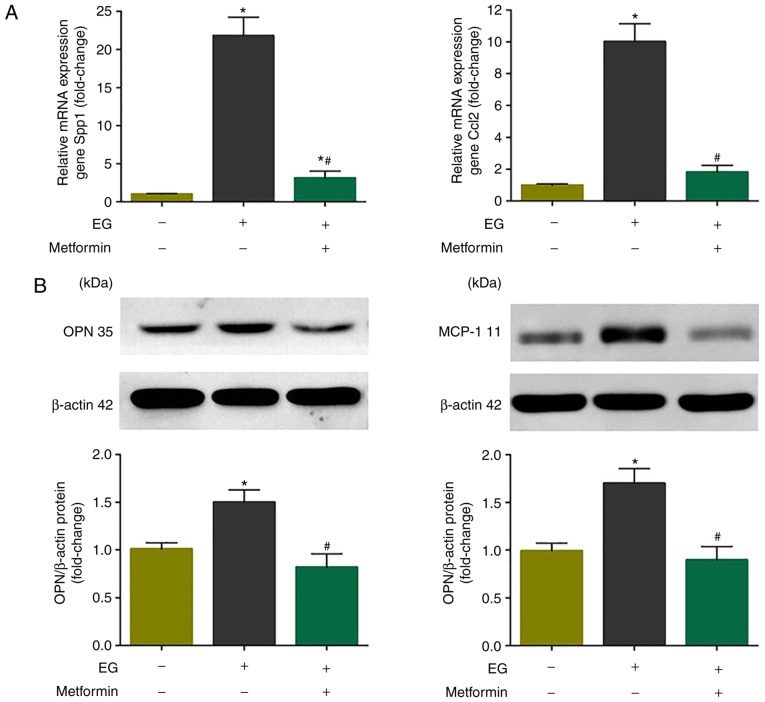
Figure 5.
Evaluation of the mRNA transcription and protein expression of OPN and MCP-1 in rat kidneys. (A) Reverse transcription-quantitative polymerase chain reaction analysis of expression levels of OPN (left panel) and MCP-1 (right panel) in rat kidneys; values were corrected for GAPDH. Protein expression of (B) OPN (left panel) and MCP-1 (right panel) in rat kidneys. The data are presented as the mean ± standard deviation of six independent experiments. *P<0.05 vs. control group; #P<0.05 vs. sodium oxalate group. Statistical analyses were performed by one-way analysis of variance. OPN, osteopontin; MCP-1, monocyte chemoattractant protein 1; EG, ethylene glycol.

