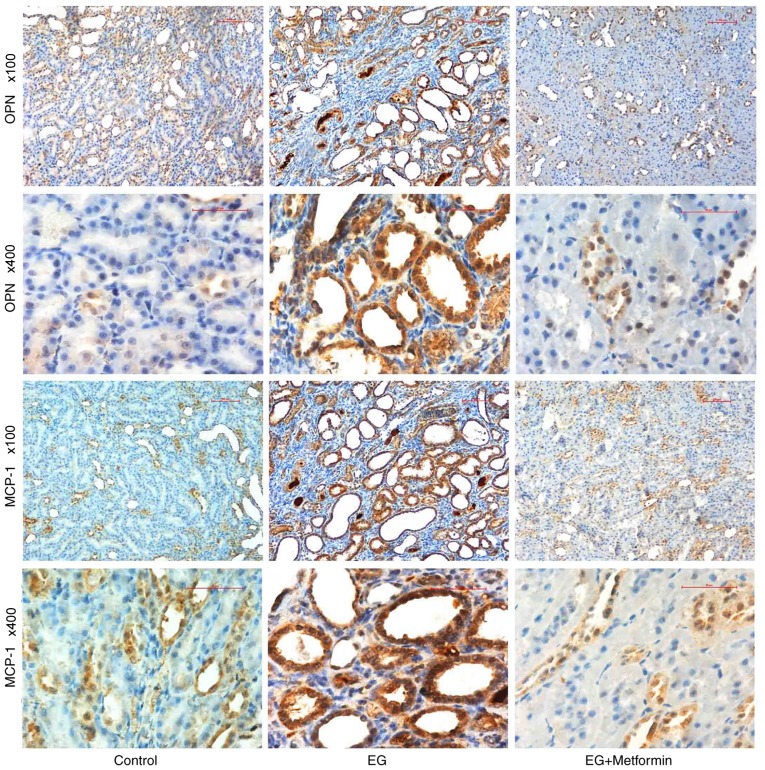
Figure 6.
Immunohistochemical distribution of the expression of OPN and MCP-1 in rat kidneys harvested following an 8-week treatment period. The left column comprises representative images showing the expression of OPN and MCP-1 in control rats, the middle column comprises representative images showing the expression of OPN and MCP-1 in EG-treated rats and the right column comprises representative images showing the expression of OPN and MCP-1 in EG + metformin-co-treated rats. OPN, osteopontin; MCP-1, monocyte chemoattractant protein 1; EG, ethylene glycol.

