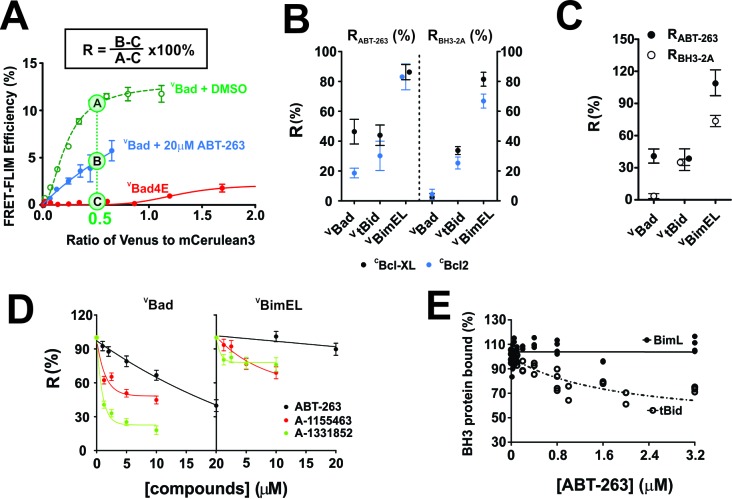
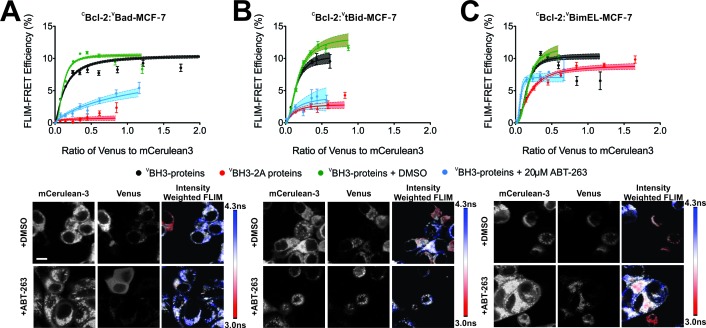
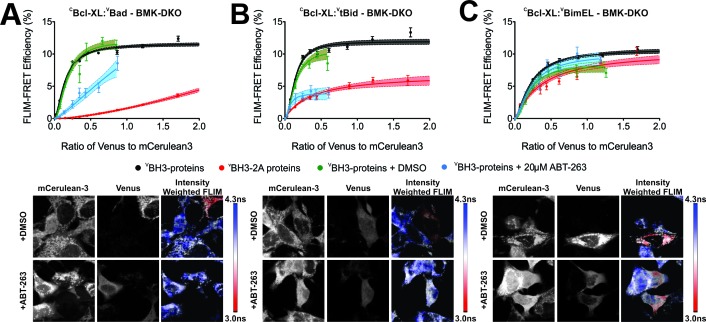
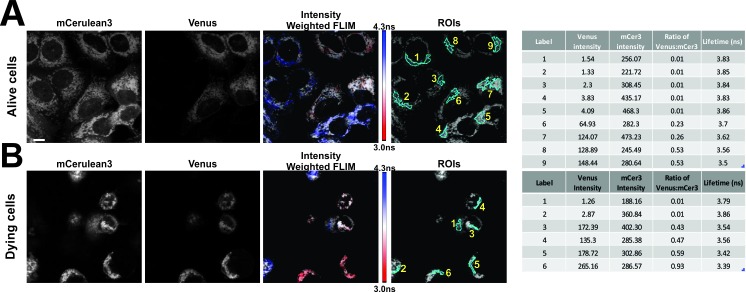
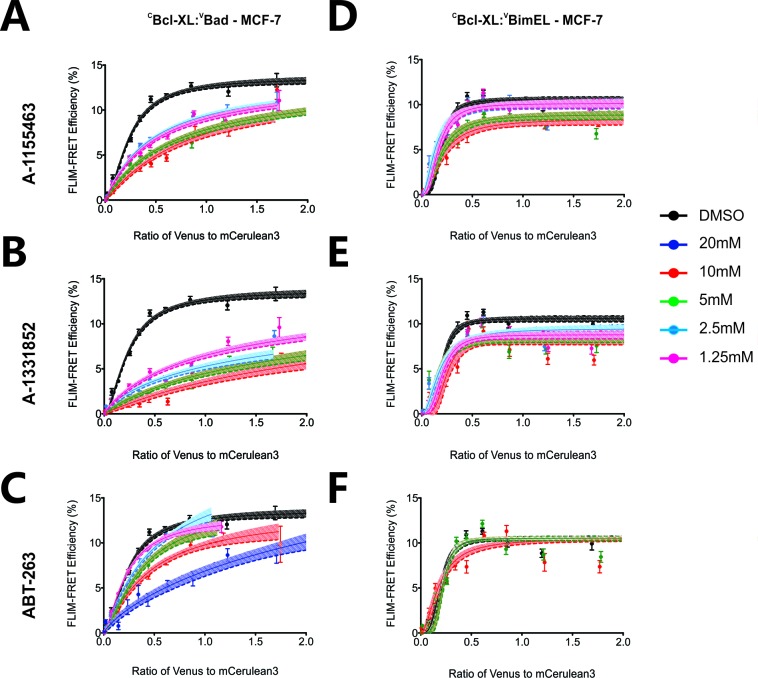
Figure 2. with four supplements: The impact of small-molecule inhibitors and BH3-sequence mutations on the interactions between anti-apoptotic proteins and BH3-only pro-apoptotic proteins.
(A) Values of R can be used to define binding interactions from FLIM-FRET data. Sample calculation of RABT-263 for CBcl-XL:VBad binding in MCF-7 cells. To maximize the accuracy and dynamic range of the assay to quantify the impact of ABT-263 on the VBH3-proteins binding to CBcl-XL, we interpolated the FLIM-FRET efficiency from the fitted binding curves at an intensity ratio of Venus to mCer3 of 0.5 (points A, (B and C). The non-binding mutant VBad4E, in which h1, h2, h3 and h4 in the BH3 region were all mutated to glutamic acid, served as a control for FRET due to random collisions (red line, point C) and was subtracted from A and B as background. The signal remaining after the addition of ABT-263 (cyan line, point B) expressed as a percentage of the signal with DMSO added instead of the drug (green line, point A) is defined as RABT-263. (B) RABT-263 and RBH3-2A for binding of the indicated VBH3-proteins to CBcl-XL (black) from binding curves in shown in Figure 1and CBcl-2 (blue) in MCF-7 cells. RBH3-2A is calculated similarly to RABT-263 except the FLIM-FRET efficiency of the mutant is substituted for the value after adding ABT-263. Binned data, binding curves and sample images for Bcl-2 are shown in Figure 2—figure supplement 1. (C) The RABT-263 and RBH3-2A values for CBcl-XL:VBH3 proteins interactions in BMK-DKO cells. Binned data, binding curves and sample images are shown in Figure 2—figure supplement 2. Control experiments showing that the morphology changes that accompany cell death do not change the lifetime values determined by FLIM are shown in Figure 2—figure supplement 3. (D) Bcl-XL inhibitors displace VBad efficiently but VBimEL poorly from CBcl-XL in live cells. The dose-dependent inhibition curves due to the indicated concentrations of ABT-263 (black), and the Bcl-XL inhibitors A-1155463 (red) and A-1331852 (green) shown for CBcl-XL:VBad (left) and CBcl-XL:VBimEL (right) complexes in live MCF-7 cells. R values are ±95% confidence intervals from binned data and binding curves shown in Figure 2—figure supplement 4 (E) ABT-263 displaces tBid (10 nM) but not Bim (10 nM) from Bcl-XL (40 nM) in vitro. Percent of BH3 protein bound to Bcl-XL (BH3 bound %) measured by loss of FRET for Bcl-XL:tBid and Bcl-XL:Bim quantified for purified full-length dye labeled proteins incubated with liposomes and the indicated concentrations of drug. Data are from three experimental replicates, not all points are visible due to overlap. In all figures RABT-263 and RBH3-2A data points for Bcl-XL and Bcl-2 are black and blue respectively.

