. 2019 Mar 12;8:e37689. doi: 10.7554/eLife.37689

Figure 6. h0 and h1 residues in the Bim BH3 contribute to the resistance of Bcl-XL:Bim complexes to ABT-263.

(A) Sequence alignment of the BH3 regions of Bad and Bim and the sequences of VBad-Bim mutants, residues from Bad (red), Bim (blue). (B) Identification of conserved hydrophobic residues in the Bim BH3 that contributed to RABT-263 for CBcl-XL:VBad-Bim (black) and CBcl-2:VBad-Bim (blue) complexes. The RABT-263 values of CBcl-XL:VBad-Bim and CBcl-2:VBad-Bim complexes from Figure 4b and Table 1 were included to facilitate direct comparison. (C) The BH3 h1 residue I146 contributes to Bim binding to Bcl-2 and Bcl-XL. Substitution of I146 with the corresponding residue from Bad (BimEL-I146Y) decreased RABT-263 for CBcl-XL: VBimEL/VBimEL-dCTS (black) and CBcl-2:VBimEL/VBimEL-dCTS (blue) complexes. Data are mean ±95% confidence intervals calculated from FLIM-FRET binding curves shown in Figure 6—figure supplement 1.
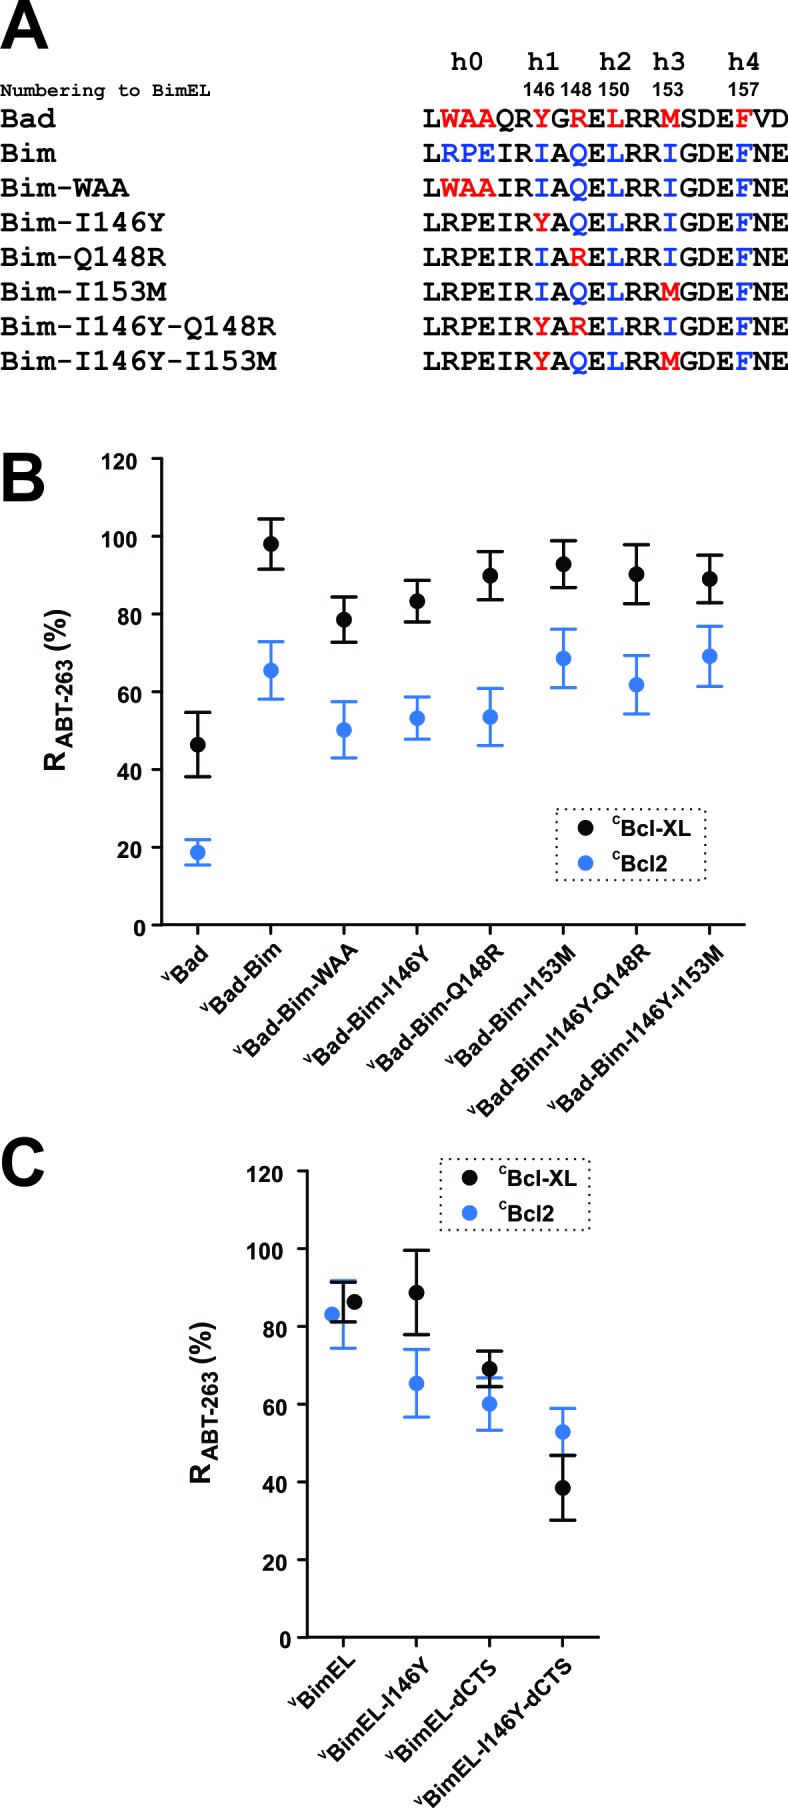
Figure 6—source data 1. Source data for the calculation of R values for mutants demonstrating that the h0 and h1 residues in the Bim BH3 contribute to the resistance of Bcl-XL:Bim complexes to ABT-263.
DOI: 10.7554/eLife.37689.024

Figure 6.

Figure 6—figure supplement 1. The h0 and h1 residues in the Bim BH3 region contribute to the resistance of Bcl-XL:Bim and Bcl-2:Bim complexes to ABT-263.

Figure 6—figure supplement 1.

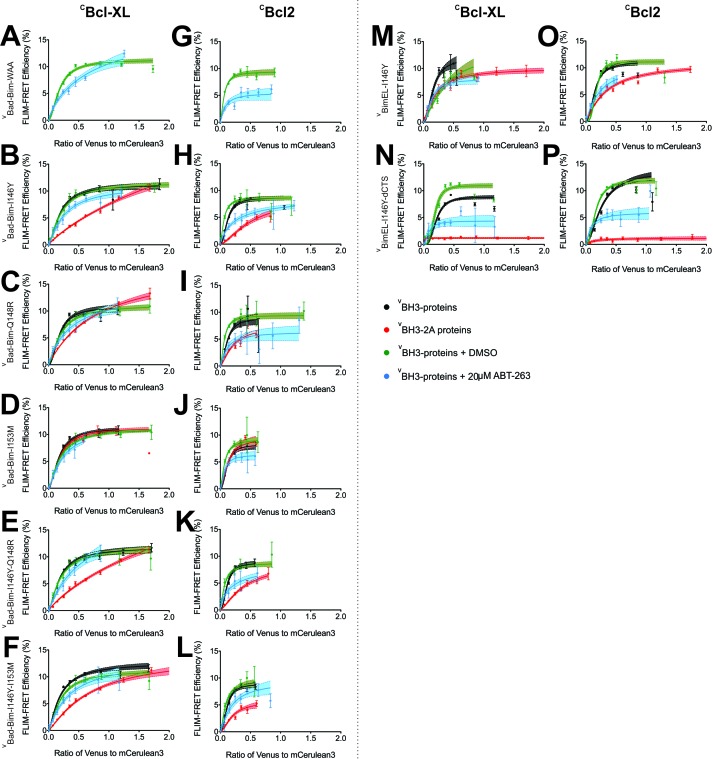
(A–L) Binding of VBad-Bim chimeric proteins to CBcl-XL (left) and CBcl-2 (right) in MCF-7 cells. The VBad-Bim chimeric proteins are comprised of VBad with the BH3 region replaced with the corresponding region from Bim. Additional point mutations in the Bim BH3 region are indicated to the left of each pair of panels. (M–P) Impact of I146 on the binding of VBimEL or VBimEL-dCTS to CBcl-XL (left) and CBcl-2 (right) in MCF-7 cells. Additional point mutations in VBimEL are indicated to the left of each pair of panels. The binding curves illustrate the extent of binding of untreated (black) and DMSO treated (green) controls, cells treated with 20 μM ABT-263 (blue) or additional BH3-2A mutation (red). Data points in FLIM-FRET binding curves correspond to the average FLIM-FRET efficiency for binned data (20 cells/bin 3,000). Error bars, SEM; shadowed area, 95% confidence interval for the best fit of the model to the data.
Figure 6—figure supplement 1—source data 1. Source data fitted to a Hill equation to determine the extent to which residues in the Bim BH3 region contribute to the resistance of Bcl-XL:Bimand Bcl-2:Bim complexes to ABT-263.
DOI: 10.7554/eLife.37689.026