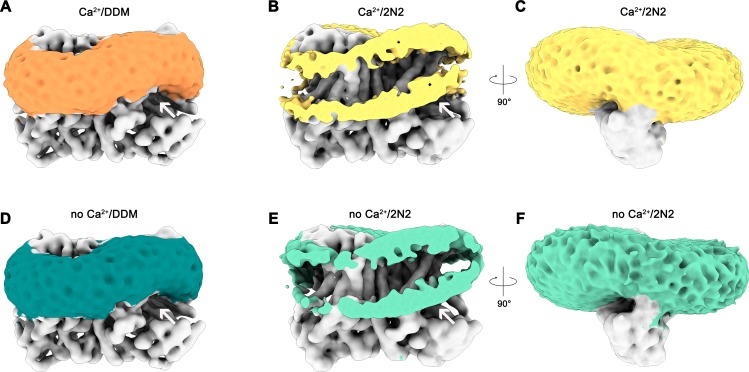
Figure 6. Detergent and lipid interactions.
Shown are refined and unmasked cryo-EM density maps low-pass filtered to 6 Å. (A) Map of the Ca2+-bound nhTMEM16 data in detergent contoured at 4 σ; (B,C) Map of the Ca2+-bound nhTMEM16 data in nanodiscs contoured at 3.2 and 1.6 σ; (D) Map of the Ca2+-free nhTMEM16 data in detergent contoured at 4 σ; (E and F), Map of the Ca2+-free nhTMEM16 data in nanodiscs contoured at 3.2 and 1.6 σ. The density corresponding to the detergent micelle or the nanodisc, which is composed of lipids surrounded by the 2N2 belt protein, are colored in orange, yellow, dark green and light green, respectively, density of nhTMEM16 is shown in gray. A,B,D,E show a front view of the dimer similar to Figure 1A and the subunit cavity is indicated by a white arrow. B, E, clipped maps reveal the headgroup regions of both membrane leaflets. C,F, are viewed in direction of the subunit cavity.

