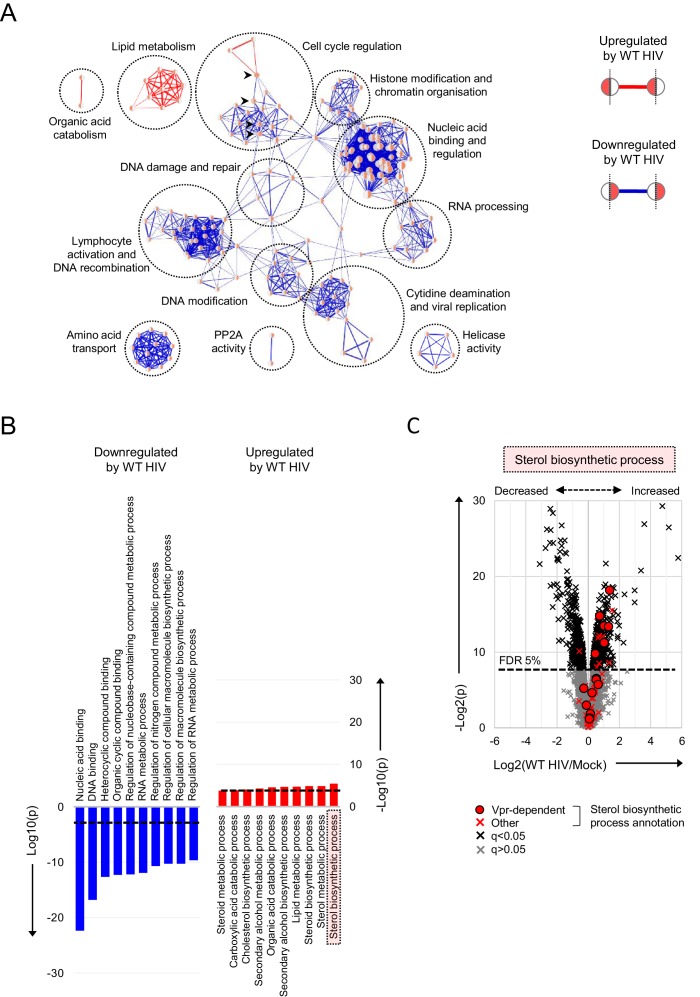
Figure 4. Pathways regulated by HIV in primary T cells.
(A–B) Gene Ontology (GO) functional annotation terms enriched amongst upregulated or downregulated proteins with q < 0.05 in WT HIV-infected vs mock-infected cells from single time point proteomic experiment (Figure 3A). In the Enrichment Map (Merico et al., 2010) network-based visualisation (A), each node represents a GO term, with node size indicating number of annotated proteins, edge thickness representing degree of overlap (red, enriched amongst upregulated proteins; blue, enriched amongst downregulated proteins) and similar GO terms placed close together. Degree of enrichment is mapped to node colour (left side, enriched amongst upregulated proteins; right side, enriched amongst downregulated proteins) as a gradient from white (no enrichment) to red (high enrichment). Highlighted nodes (arrow heads) represent GO terms enriched amongst both upregulated and downregulated proteins. In the bar charts (B), the 10 most enriched GO terms (ranked by p value) amongst upregulated (red) and downregulated (blue) proteins are shown, with an indicative Benjamini-Hochberg FDR threshold of 5% (dashed line). (C) Protein abundances in WT HIV-infected vs mock-infected cells from single time point proteomic experiment (Figure 3A), with details for volcano plot as in Figure 3C. 57 proteins annotated with the GO term ‘sterol biosynthetic process’ (GO:0016126) are highlighted in red. Amongst these, 15 proteins are regulated by Vpr in CEM-T4s (circles) (Greenwood et al., 2019).

