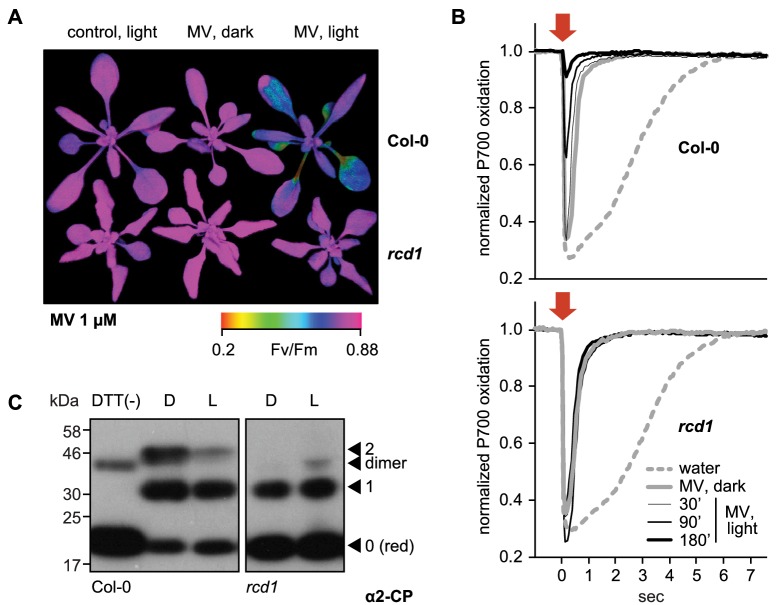
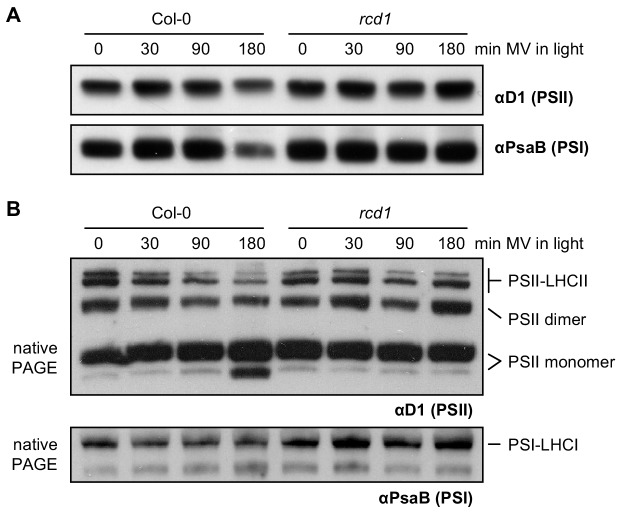
Figure 1. RCD1 controls tolerance of photosynthetic apparatus to ROS.
(A) MV treatment results in PSII inhibition under light, which is suppressed in the rcd1 mutant. PSII photochemical yield (Fv/Fm) was measured in rosettes pre-treated overnight in darkness with 1 μM MV and then exposed to 3 hr of continuous light (80 µmol m−2 s−1). Representative false-color image of Fv/Fm is shown. (B) Access of MV to electron-acceptor side of PSI is unaltered in rcd1. Treatment with MV led to similar changes in kinetics of PSI oxidation in Col-0 and rcd1. Oxidation of PSI reaction center (P700) was measured using DUAL-PAM. Leaves were first adapted to far-red light that is more efficiently used by PSI than PSII. In these conditions PSI is producing electrons at a faster rate than they are supplied by PSII, thus P700 is oxidized. Then a flash of orange light was provided that is efficiently absorbed by PSII (orange arrow). Electrons generated by PSII transiently reduced PSI, after which the kinetics of PSI re-oxidation was followed. Note the progressive decrease in the effect of the orange flash occurring in Col-0 at later time points, which suggests deterioration in PSII function. This was not observed in rcd1. Three leaves from three individual plants were used for each measurement. The experiment was repeated three times with similar results. (C) Redox state of the chloroplast enzyme 2-Cys peroxiredoxin (2-CP) assessed by thiol bond-specific labeling in Col-0 (left) and rcd1 (right). Total protein was isolated from leaves incubated in darkness (D), or under light (L). Free sulfhydryls were blocked with N-ethylmaleimide, then in vivo thiol bridges were reduced with DTT, and finally the newly exposed sulfhydryls were labeled with methoxypolyethylene glycol maleimide of molecular weight 5 kDa. The labeled protein extracts were separated by SDS-PAGE and immunoblotted with α2-CP antibody. DTT (-) control contained predominantly unlabeled form. Unlabeled reduced (red), singly and doubly labeled oxidized forms and the putative dimer were annotated as in Nikkanen et al. (2016). Apparent molecular weight increment after the labeling of one thiol bond appears on SDS-PAGE higher than 10 kDa because of steric hindrance exerted on branched polymers during gel separation (van Leeuwen et al., 2017). The experiment was repeated three times with similar results.
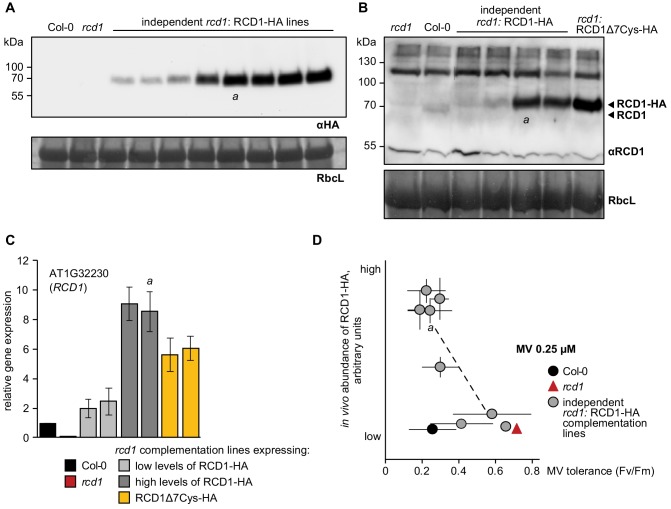
Figure 1—figure supplement 1. Inverse correlation of RCD1 abundance with tolerance to chloroplastic ROS.
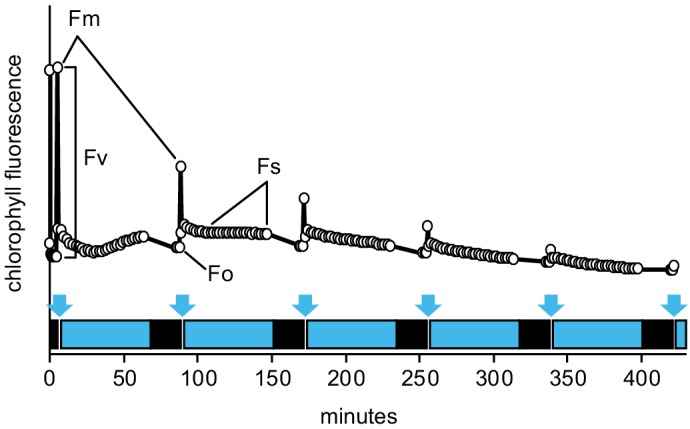
Figure 1—figure supplement 2. The Imaging PAM protocol developed to monitor kinetics of PSII inhibition by repetitive 1 hr light cycles.
