. 2019 Feb 15;8:e43284. doi: 10.7554/eLife.43284

Figure 2. RCD1 protein is sensitive to chloroplastic ROS.

(A) The rcd1: RCD1-HA complementation line was used to assess RCD1-HA abundance. It gradually decreased in response to chloroplastic ROS. Leaf discs from plants expressing HA-tagged RCD1 were treated with 5 hr growth light (150 µmol m−2 s−1), high light (1300 µmol m−2 s−1), MV (1 µM) in light, or H2O2 (100 mM). The levels of RCD1-HA were monitored by immunoblotting with αHA at indicated time points. Rubisco large subunit (RbcL) detected by amido black staining is shown as a control for equal protein loading. The ‘0’ time point of the MV time course represents dark-adapted leaf discs pre-treated with MV overnight. The experiment was performed four times with similar results. (B) Chloroplastic ROS caused oligomerization of RCD1-HA. Total protein extracts from the plants treated as in panel (A) were separated by non-reducing PAGE and immunoblotted with αHA antibody. Reduced (red) and oxidized (ox) forms of the protein are labeled. To ascertain that all HA-tagged protein including that forming high-molecular-weight aggregates has been detected by immunoblotting, the transfer to a membrane was performed using the entire SDS-PAGE gel including the stacking gel and the well pockets. The experiment was performed four times with similar results.

Figure 2—source data 1. Source data and statistics.
elife-43284-fig2-data1.xlsx (172.5KB, xlsx)
DOI: 10.7554/eLife.43284.012

Figure 2.

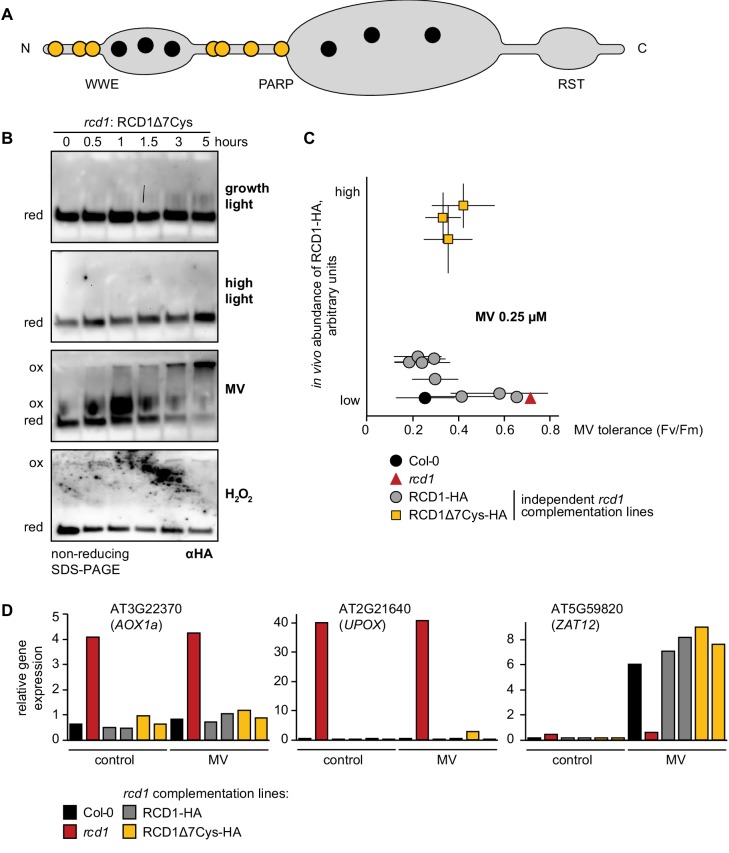
Figure 2—figure supplement 1. Characterization of the rcd1: RCD1Δ7Cys-HA lines.

Figure 2—figure supplement 1.

(A) Domain structure of RCD1 with the positions of cysteine residues shown with circles. Interdomain cysteines mutated in the RCD1Δ7Cys-HA lines (RCD1Δ7Cys = RCD1 C14A-C37A-C50A-C175A-C179A-C212A-C243A) are shown in yellow. (B) The rcd1 complementation line expressing the RCD1Δ7Cys-HA variant under the control of the native RCD1 promoter was treated with high light, MV or H2O2 as described in Figure 2. In this line accumulation of high-molecular-weight RCD1 aggregates observed in RCD1-HA line (Figure 2B) was largely abolished. Reduced (red) and oxidized (ox) forms of the protein are labeled. To ascertain that all HA-tagged protein including that forming high-molecular-weight aggregates has been detected by immunoblotting, the transfer to a membrane was performed using the entire SDS-PAGE gel including the stacking gel and the well pockets. The experiment was performed three times with similar results. (C) Independent single-insertion homozygous rcd1 complementation lines expressing RCD1Δ7Cys-HA were compared to those expressing RCD1-HA as described in Figure 1—figure supplement 1D. In all the tested lines, RCD1Δ7Cys-HA accumulated to higher amounts than the wild-type RCD1-HA as revealed by immunoblotting with αHA antibody. MV tolerance of the RCD1Δ7Cys-HA lines was not different from that of the RCD1-HA lines or Col-0. Source data and statistics are presented in Figure 2—source data 1. (D) Expression of RCD1-regulated genes was measured by real time quantitative PCR in Col-0, rcd1, two rcd1: RCD1-HA lines expressing high levels of RCD1-HA and two lines expressing RCD1Δ7Cys-HA. No difference in expression of the selected RCD1-regulated genes AOX1a (AT3G22370), UPOX (AT2G21640), or the stress-induced gene ZAT12 (AT5G59820) was detected in the rcd1: RCD1Δ7Cys-HA line as compared to rcd1: RCD1-HA or Col-0. For MV treatment detached rosettes were soaked in 1 μM MV overnight in the darkness and then exposed to 1 hr of white luminescent light of 220–250 µmol m−2 s−1. Note that inactivation of RCD1 prevented induction of a general stress marker gene ZAT12 in response to MV. Five rosettes were pooled together for each sample. The experiment was repeated twice with similar results. Source data and statistics are presented in Figure 2—source data 1.