
Figure 4. Mitochondrial AOXs affect energy metabolism of rcd1 and alter response to chloroplastic ROS.
Source data and statistics are presented in Figure 4—source data 1. (A) Expression of AOXs is induced in rcd1. Abundance of AOX isoforms in mitochondrial preparations was assessed by immunoblotting with αAOX antibody that recognizes AOX1a, -b, -c, -d, and AOX2 isoforms. 100% corresponds to 15 μg of mitochondrial protein. (B) Two mitochondrial respiratory pathways (red arrows) and sites of action of mitochondrial inhibitors. KCN inhibits complex IV (cytochrome c oxidase). Salicylhydroxamic acid (SHAM) inhibits AOX activity. Antimycin A (AA) and myxothiazol (myx) block electron transfer through complex III (ubiquinol-cytochrome c oxidoreductase), creating ROS-related mitochondrial retrograde signal. (C) AOX capacity is significantly increased in rcd1. Oxygen uptake by seedlings was measured in the darkness in presence of KCN and SHAM. Addition of KCN blocked respiration through complex IV, thus revealing the capacity of the alternative respiratory pathway through AOXs. Data are presented as mean ±SD, asterisks denote selected values that are significantly different (P value < 0.001, one-way ANOVA with Bonferroni post hoc correction). Each measurement was performed on 10–15 pooled seedlings and repeated at least three times. (D) Inhibitors of mitochondrial complex III increase plant tolerance to chloroplastic ROS. Effect of pre-treatment with 2.5 μM AA or 2.5 μM myx on PSII inhibition (Fv/Fm) by MV. For each experiment, leaf discs from at least four individual rosettes were used. The experiment was performed four times with similar results. Mean ±SD are shown. Asterisks indicate selected treatments that are significantly different (P value < 0.001, Bonferroni post hoc correction). AOX abundance in the leaf discs treated in the same way was quantified by immunoblotting (Figure 4—figure supplement 1). (E) AOX inhibitor SHAM decreases plant tolerance to chloroplastic ROS. 1 hr pre-treatment with 2 mM SHAM inhibited tolerance to 1 μM MV both in Col-0 and rcd1 as measured by Fv/Fm. SHAM stock solution was prepared in DMSO, thus pure DMSO was added in the SHAM-minus controls. For each experiment, leaf discs from at least four individual rosettes were used. The experiment was performed four times with similar results. Mean ±SD are shown. Asterisks indicate significant difference in the treatments of the same genotype at the selected time points (P value < 0.001, Bonferroni post hoc correction).

Figure 4—figure supplement 1. Effect of mitochondrial complex III inhibitors on expression of AOXs in Col-0 and rcd1.
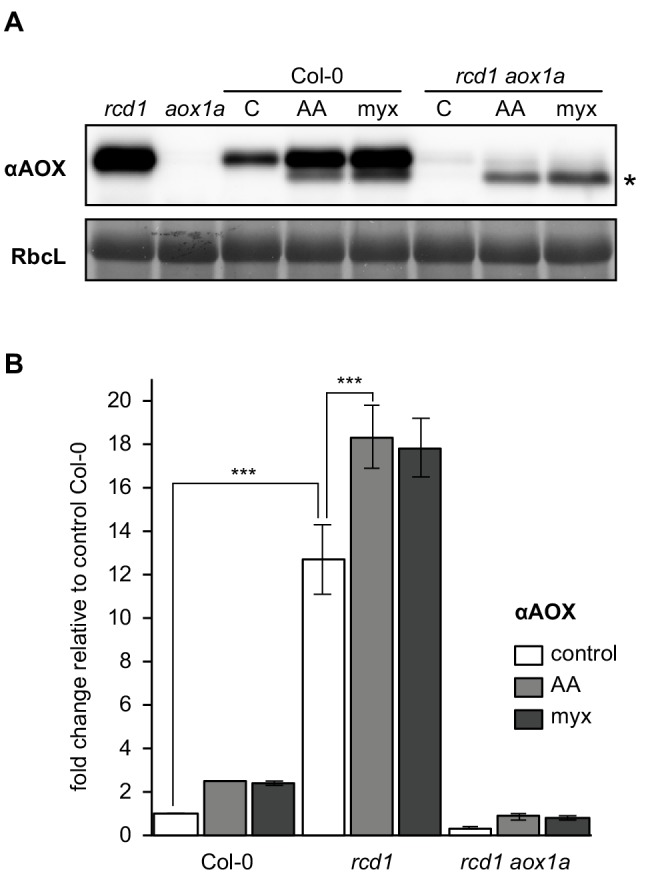
Figure 4—figure supplement 2. Effect of mitochondrial complex III inhibitors on abundance and redox state of the RCD1 protein.

Figure 4—figure supplement 3. Specificity of inhibitor treatments.

Figure 4—figure supplement 4. Irrelevance of AOX1a isoform for MV tolerance.
