Figure 5. Altered electron transfer between the organelles in rcd1.
(A) Leaf discs were pre-treated with 1 μM MV or MV plus 2 mM SHAM for 1 hr in the darkness. Then light was turned on (80 µmol m−2 s−1) and chlorophyll fluorescence under light (Fs) was recorded by Imaging PAM. Application of the two chemicals together caused Fs rise in rcd1, but not Col-0, suggesting increase in the reduction state of the chloroplast ETC in rcd1. For analysis of photochemical quenching see Figure 5—figure supplement 1. (B) Malate levels are significantly decreased in Col-0 but not in rcd1 after MV treatment in light. Malate level was measured in extracts from Col-0 and rcd1 seedlings that were pre-treated overnight with 50 μM MV or water control and collected either dark-adapted or after exposure to 4 hr of light. Mean ±SE are shown. Asterisks indicate values significantly different from those in the similarly treated wild type, ***P value < 0.001, **P value < 0.01, Student’s t-test). For statistics, see Figure 5—source data 1. (C) NADPH-MDH activity is increased in rcd1. To measure the activity of chloroplastic NADPH-MDH, plants were grown at 100–120 µmol m−2 s−1 at an 8 hr day photoperiod, leaves were collected in the middle of the day and freeze-dried. The extracts were prepared in the buffer supplemented with 250 μM thiol-reducing agent DTT, and initial activity was measured (top left). The samples were then incubated for 2 hr in the presence of additional 150 mM DTT, and total activity was measured (top right). The activation state of NADPH-MDH (bottom) is presented as the ratio of the initial and the total activity. Mean ±SE are shown. Asterisks indicate values significantly different from the wild type, **P value < 0.01, *P value < 0.05, Student’s t-test. For statistics, see Figure 5—source data 1.
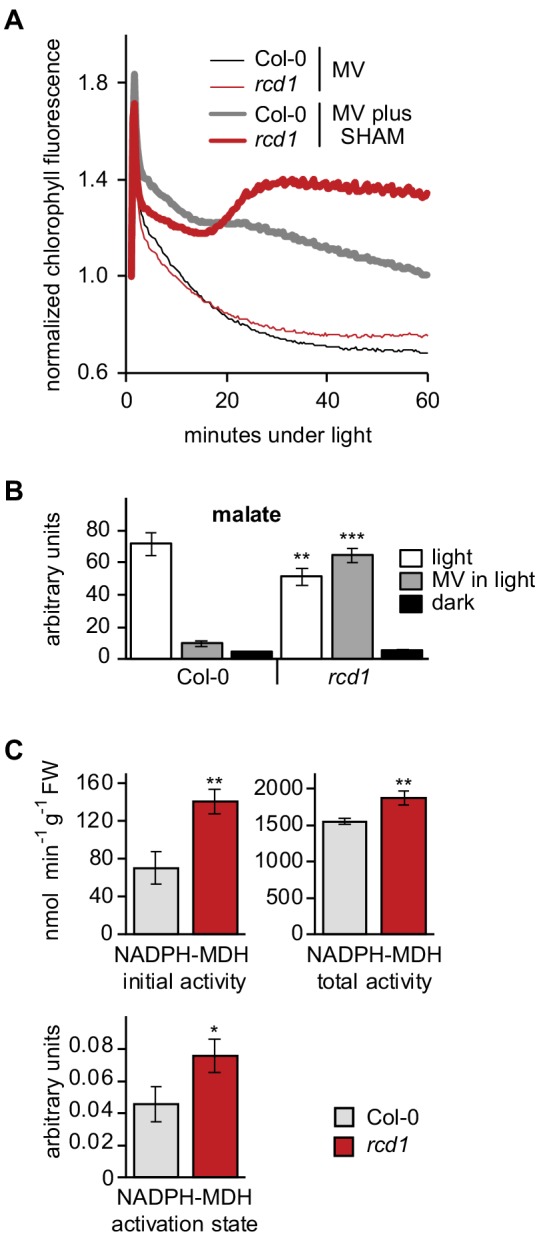
Figure 5—figure supplement 1. Alterations in chloroplast electron transfer induced by MV and SHAM.

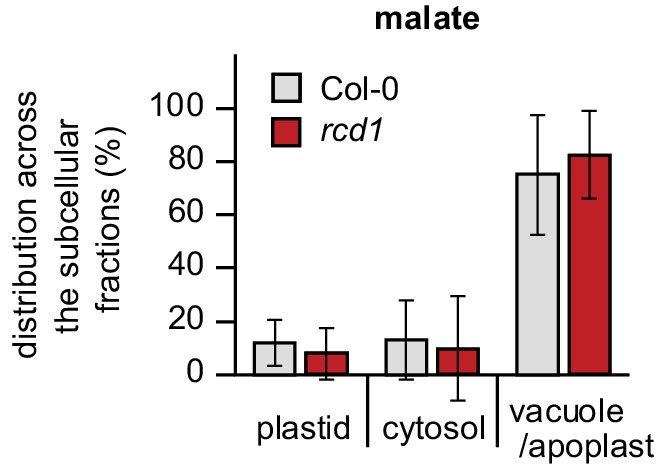
Figure 5—figure supplement 2. Distribution of malate in subcellular compartments of Col-0 and rcd1.