. 2019 Feb 15;8:e43284. doi: 10.7554/eLife.43284

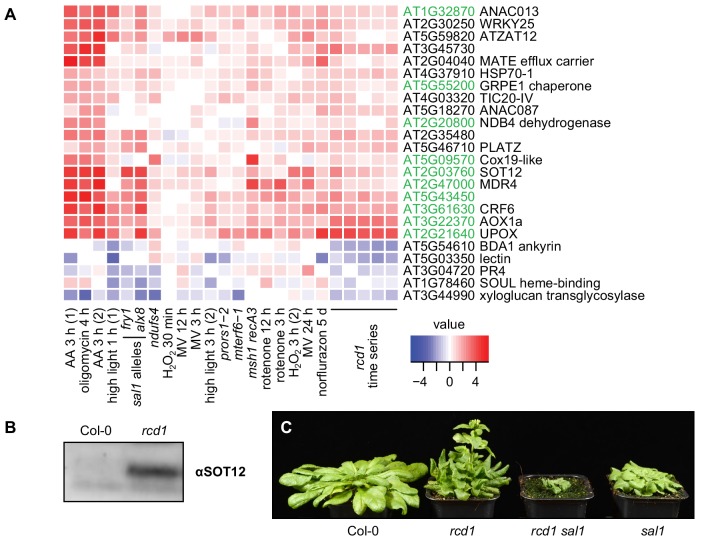
Figure 6. RCD1 is involved in mitochondrial dysfunction, chloroplast ROS and PAP signaling pathways.

(A) Regulation of rcd1 mis-expressed genes under perturbations of organellar functions in the selected subset of genes. A complete list of rcd1-misexpressed genes is presented in Figure 6—figure supplement 1. Similar transcriptomic changes are observed between the genes differentially regulated in rcd1 and the genes affected by disturbed chloroplastic or mitochondrial functions. Mitochondrial dysfunction stimulon (MDS) genes regulated by ANAC013/ANAC017 transcription factors, are labeled green. (B) Sulfotransferase SOT12 encoded by an MDS gene accumulated in rcd1 under standard growth conditions, as revealed by immunoblotting with the specific antibody. (C) Phenotype of the rcd1 sal1 double mutant under standard growth conditions (12 hr photoperiod with white luminescent light of 220–250 µmol m−2 s−1).

Figure 6—source data 1. Source data and statistics.
DOI: 10.7554/eLife.43284.030

Figure 6.

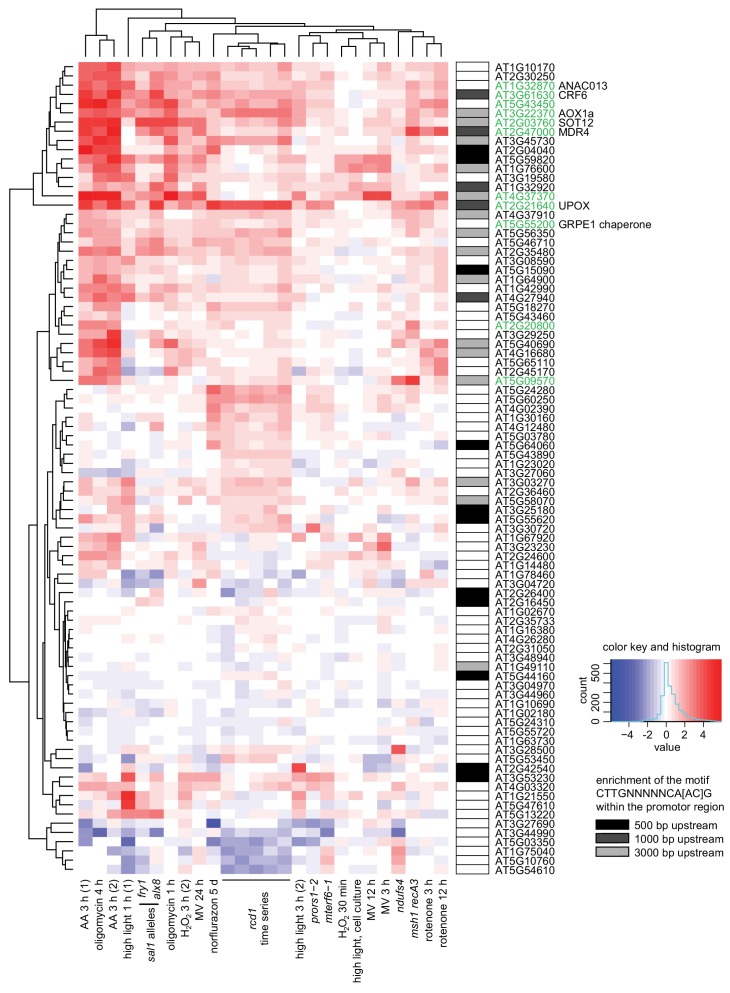
Figure 6—figure supplement 1. Clustering analysis of genes mis-regulated in rcd1 (with cutoff of logFC <0.5) in published gene expression data sets acquired after perturbations of chloroplasts or mitochondria.

Figure 6—figure supplement 1.

Mitochondrial dysfunction stimulon (MDS) genes are labeled green. Enrichment of the ANAC013/ANAC017 cis-element CTTGNNNNNCA[AC]G (De Clercq et al., 2013) in promoter regions is shown by shaded boxes next to the gene names. Notably, MDS genes represent only a subclass of all genes whose expression is affected by RCD1. For example, a cluster of genes that have lower expression in both rcd1 and sal1 mutants and are mostly associated with defense against pathogens did not have enrichment of ANAC motif in their promoters. This is likely a consequence of interaction of RCD1 with about forty different transcription factors belonging to several families (Jaspers et al., 2009).
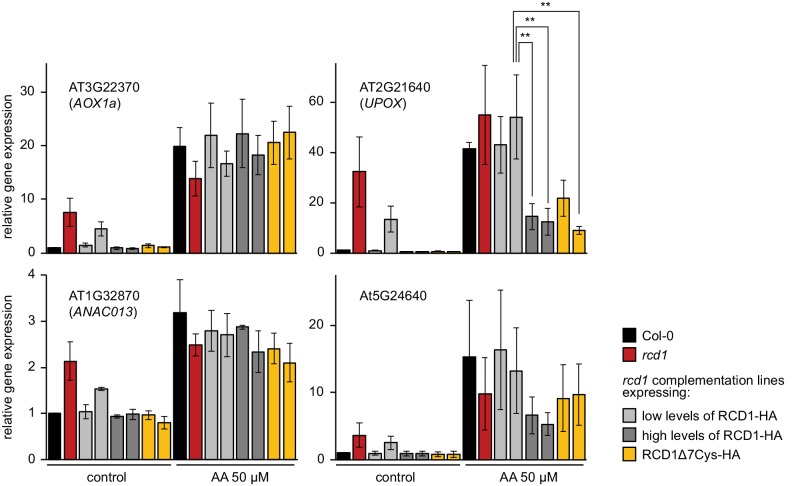
Figure 6—figure supplement 2. Induction of MDS genes in rcd1 and rcd1 complementation lines.

Figure 6—figure supplement 2.

To address the role of RCD1 in transcriptional response to AA, plant rosettes were sprayed with water solution of 50 μM AA (or of DMSO as the control). This concentration of AA has been commonly used in the studies (De Clercq et al., 2013; Ng et al., 2013a; Ng et al., 2013b; Ivanova et al., 2014). However, in addition to mitochondria, AA is known to inhibit chloroplast cyclic electron flow (Labs et al., 2016). In vivo, this side effect is pronounced at a 20 μM, but not at a 2 μM AA concentration (Watanabe et al., 2016). After 3 hr incubation under growth light, relative expression of the selected MDS genes was measured by real time quantitative PCR. Similar induction of AOX1a or ANAC013 was observed in rcd1, Col-0, rcd1: RCD1-HA, and rcd1: RCD1Δ7Cys-HA lines. Interestingly, induction of another tested MDS gene, UPOX, was suppressed in the rcd1: RCD1-HA lines expressing high levels of RCD1 and in the rcd1: RCD1Δ7Cys-HA lines (see Figure 1—figure supplement 1C for the expression of RCD1 in these lines). Analogous effect was observed for the MDS gene At5G24640, although with low statistical power (Figure 6—source data 1. Source data and statistics). Suppressed MDS induction in the lines with high levels of RCD1 was in line with the observation that RCD1 abundance in vivo inversely correlated with different tolerance of plants to MV (Figure 1—figure supplement 1). Four rosettes were pooled together for each sample. Relative expression was calculated from three biological repeats and the data were scaled relative to control Col-0. Asterisks indicate significant difference between the selected genotypes (**P value < 0.01, Bonferroni post hoc correction). Source data and statistics are presented in Figure 6—source data 1.
Figure 6—figure supplement 3. Tolerance of PSII to chloroplastic ROS in sal1 mutants.
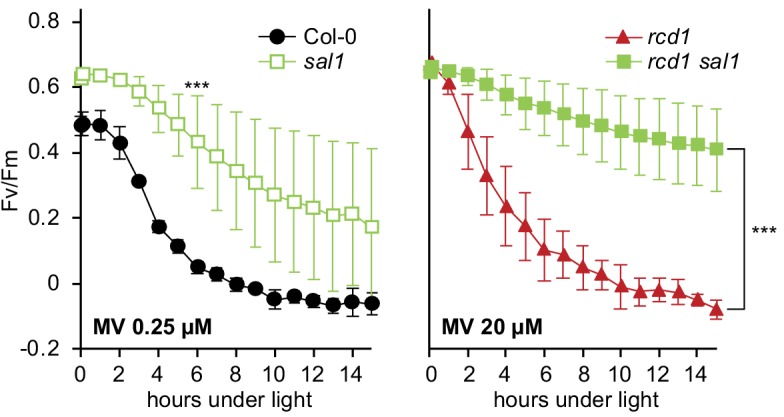
Figure 6—figure supplement 3.

MV-induced PSII inhibition was tested in 2.5 week rosettes. The single sal1 mutant was more tolerant to MV than the wild type (left panel). The double rcd1 sal1 mutant was more tolerant to MV than rcd1 (right panel). Note different concentrations of MV used in the two panels. For source data and statistics, see Figure 6—source data 1.