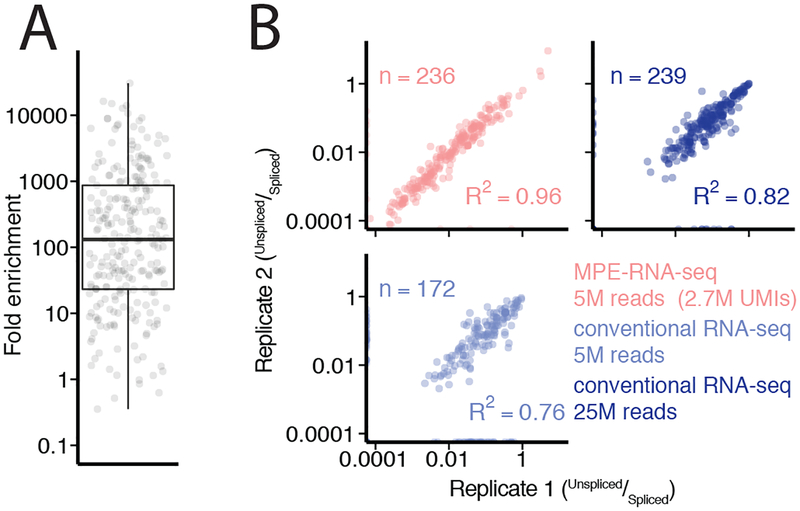
Figure2: MPE-seq enrichment enables high-precision measurements of splicing.
(A) Each point represents the fold enrichment of a target region in MPE-seq over conventional RNA-seq. Horizontal lines in boxplots represent the 25th, 50th, and 75th percentiles. Whiskers end at the 0th and 100th percentiles. n=249 target regions that were detected with at least one read in both RNA-seq and MPE-seq libraries for comparison.
(B) Scatter plots depict intron-retention measurements in replicate libraries made from biologically independent samples in MPE-seq and conventional RNA-seq at matched or greater read depth. Pearson correlation coefficients (R2) are indicated. ‘n’ is the number of intron-retention events which were quantified, requiring at least one spliced read and one unspliced read in both experiments.

