
Figure 1.
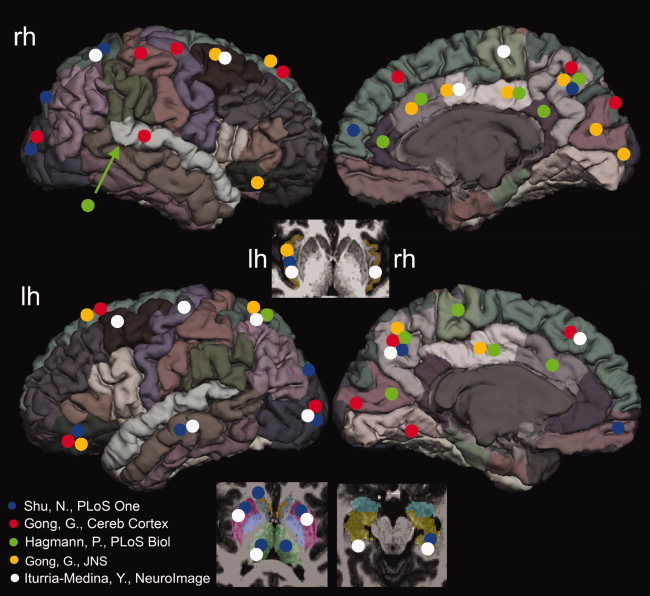
A summary of the top 20% most central nodes reported in the five prior studies. Since the tractography algorithms (i.e., probabilistic or streamline), templates (i.e., AAL or FreeSurfer), as well as graph‐theoretic measures were different in different studies, the comparisons were only approximate. It can be seen that large variability exists in the top 20% most central nodes in the literature, with the most consistent findings observed in the precuneus and middle occipital gyri. The details of the methodology differences were listed in the Supporting Information Table S1. The positions of the marking circles are in the approximate locations. [Color figure can be viewed in the online issue, which is available at wileyonlinelibrary.com.]