
Figure 10.
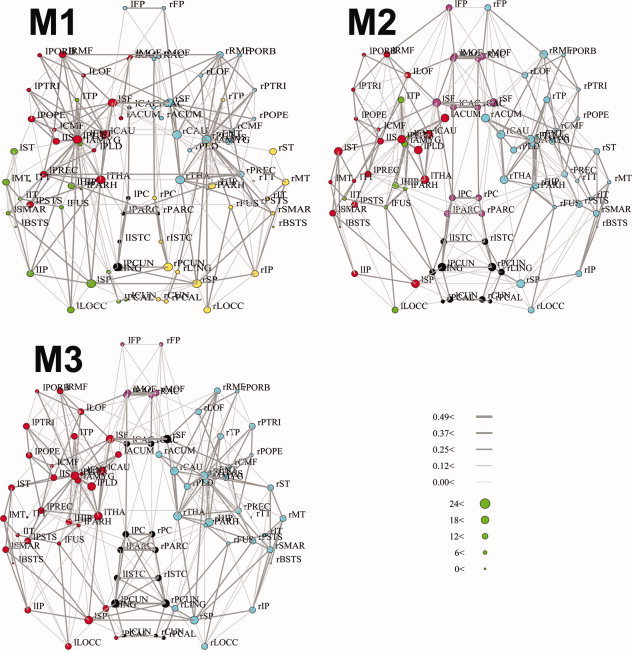
Dorsal view of the connectivity backbone derived using the M1, M2, and M3 in anatomical coordinates. Nodes are coded according to the degree and edges are coded according to the strength of NCD (NVD). The community structure of the network was obtained through subdividing the network into nonoverlapping modules, based on the algorithm proposed by Newman [2006a]. Different modules in networks were coded using different color schemes, which do not have a one‐to‐one correspondence across the three methods, as the number and size of the clusters detected were different across methods. The full name of the abbreviations used in the figures could be found in the Supporting Information Table II (Table S2). r: right hemisphere; l: left hemisphere.