
Figure 11.
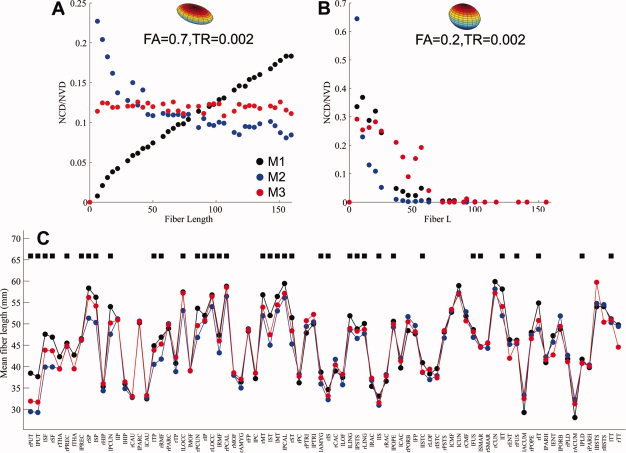
The relationships between the NCD (NVD) and fiber length in the simulated and in vivo diffusion MRI data; (A) a clear distance effect on the NCD (NVD) could be seen in M1 and M2, when fibers were coherent. This distance effect was not as significant in M3 (see Result section for details); (B) when the coherence of the white matter tracts was low, a similar distance effect was seen in all three methods, that is, probability decreased significantly with distance, and dropped off to zero for the fibers longer than 65 mm; (C) The mean fiber lengths of the white‐matter tracts that contributed to the top 20% NCD (NVD) for each brain region were plotted across the three methods. Consistent with the observations in our simulations, there were significant differences in the mean fiber length of the tracts that contributed to the top 20% NCD (NVD) for each brain region. Among 82 brain regions, 45% of them have the mean fiber length in M3 shorter than that in M1 but longer than in M2, a representation much higher than the proportion by a random chance (17%). Black squares in Fig. 11C denote the brain regions with the order of mean fiber length M1 > M3 > M2. [Color figure can be viewed in the online issue, which is available at wileyonlinelibrary.com.]