
Figure 4.
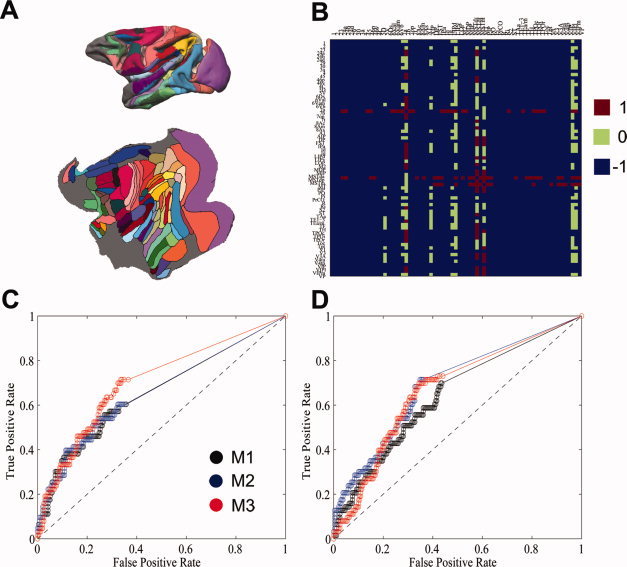
Comparison of anatomical connectivity matrices of post‐mortem macaque brain derived through invasive tracing studies and through diffusion probabilistic tractography technique. A: The partitioning scheme of LVE00a on a standard three‐dimensional (upper) and flat (lower) macaque brain. B: The anatomical connections derived by invasive tracer studies were extracted from CoCoMac LVE00a database (http://cocomac.org/home.asp). After the interregional connectivity matrices were derived using the three methods, a range of thresholds between 1 and 100% were applied on these NCD (NVD) networks and then compared with the LVE00a atlas. ROC curves for the left hemisphere (C) and right hemisphere (D) based on the three tractography methods were plotted and compared. No clear difference in performance was observed among three methods, although the mean AUC for M3 was marginally higher than that in M1 and M2, with order M3 > M2 > M1 (see Results section for details). Value 1 (0) has been used to indicate there is (not) a direct connection, while value −1 has been used to indicate that no connection information is available for the invasive tracer studies. The total 71 cortical regions compared in the present study include: 1, 2, 23, 24a, 24b, 24d, 29, 30, 3a, 4, 45, 46p, 46v, 4C, 5D, 5V, 6Ds, 6Val, 6Vam, 6Vb, 7a, 7b, 7op, 7t, 8Ac, 8Am, 8As, A1, AIP, DP, FST, IPa, Id, Ig, LIPd, LIPv, LOP, M2, MDP, MIP, MSTda, MSTdp, MSTm, MT, PIP, PO, Pi, PrCO, R, Ri, S2, ST, TAa, TE1‐3, TEa/m, TF, TH, TPOc, TPOi, TPOr, Toc, Tpt, V1, V3, V3A, V4ta, V4tp, VIP, VIPl, VIPm, VP. [Color figure can be viewed in the online issue, which is available at wileyonlinelibrary.com.]