
Figure 5.
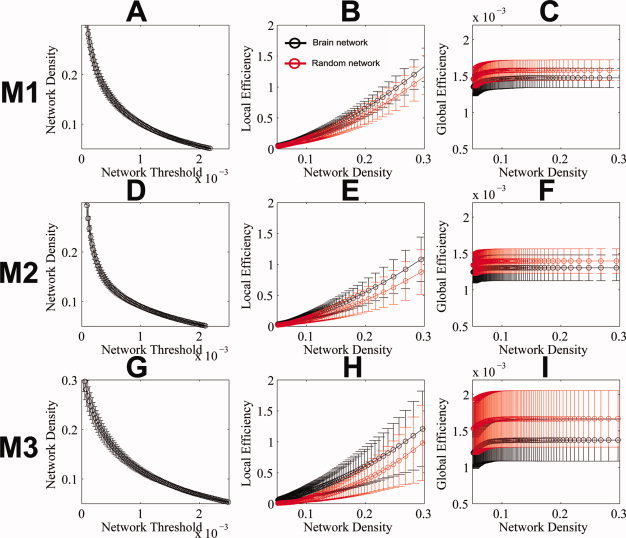
The small‐world properties of the interregional connectivity maps of the human brain. The network density, local efficiency and global efficiency are shown in A, B, C (for M1), D, E, F (for M2), and G, H, I (for M3). The network density ranges from 5 to 30%. The local and global efficiency of the derived interregional connectivity maps in this study match the description of networks with small‐world properties: high local (much higher than that of the matched random networks) and global (close to that of the matched random networks) efficiency. Both local efficiency and global efficiency of the interregional connectivity maps at the thresholds used for integration in our study (10–30%) in all three methods were significantly different from that in the matched random networks (two sample t‐tests with P < 0.05, two tails). Circles and the error bars represent the mean and one standard deviation of each measure across subjects. [Color figure can be viewed in the online issue, which is available at wileyonlinelibrary.com.]