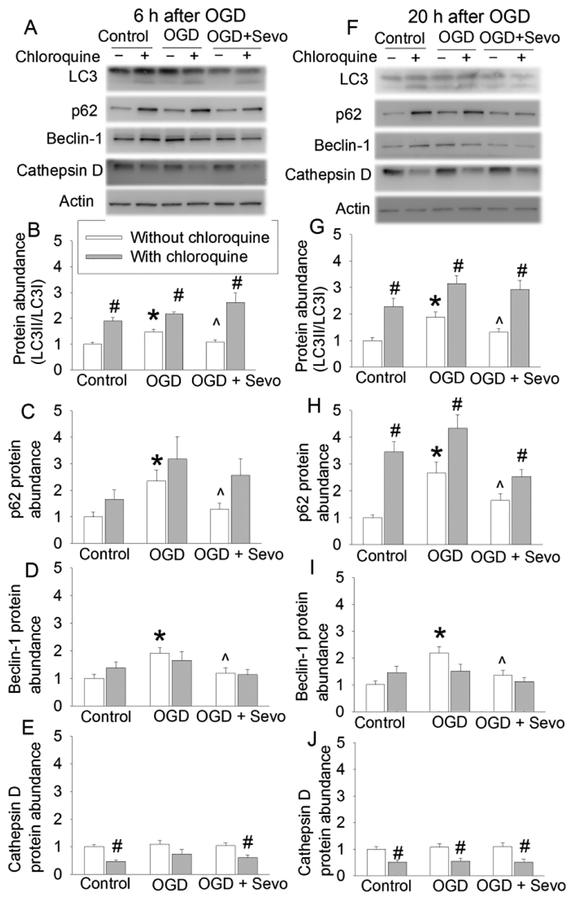
Fig. 2. Effects of 2% sevoflurane postconditioning on OGD-induced autophagic markers in human neuron-like cells.
Cells were subjected to 1 h OGD followed with 6 h or 20 h simulated reperfusion. Cells were exposed to 2% sevoflurane for 1 h immediately after the onset of simulated reperfusion. Chloroquine was added before the OGD and was present till the cells were harvested for assay. A: Representative images of Western blotting of samples harvested at 6 h after OGD. B: Quantitative results of the ratio of LC3II to LC3I at 6 h after OGD. C: Quantitative results of p62 at 6 h after OGD. D: Quantitative results of beclin-1 at 6 h after OGD. E: Quantitative results of cathepsin D at 6 h after OGD. F: Representative images of Western blotting of samples harvested at 20 h after OGD. G: Quantitative results of the ratio of LC3II to LC3I at 20 h after OGD. H: Quantitative results of p62 at 20 h after OGD. I: Quantitative results of beclin-1 at 20 h after OGD. J: Quantitative results of cathepsin D at 20 h after OGD. Results are means ± S.E.M. (n = 9). * P < 0.05 compared to control. ^ P < 0.05 compared to OGD group. # P < 0.05 compared with the corresponding condition without chloroquine. OGD: oxygen-glucose deprivation; Sevo: 2% sevoflurane.

