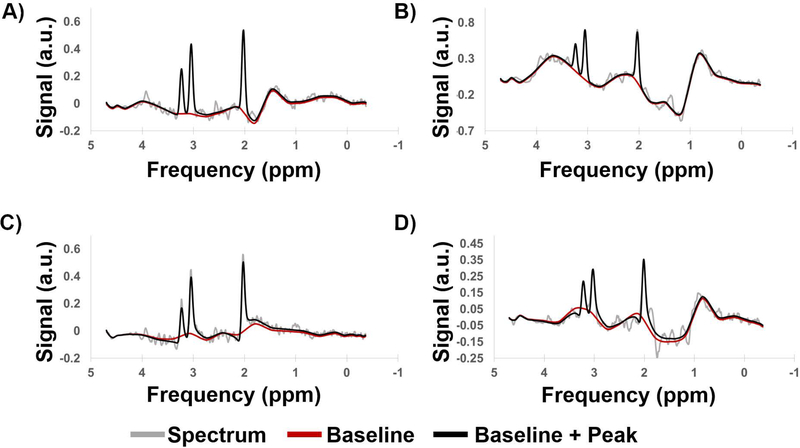
Figure 2.
Example spectra generated by CEMD, showing the real components of the computed baseline (red) and baseline + peak (black) fits overlaid on top of spectra (gray). Four different types of baseline and phase shifts are shown to indicate that CEMD is able to handle a range of input spectra. a.u. = arbitrary units.

