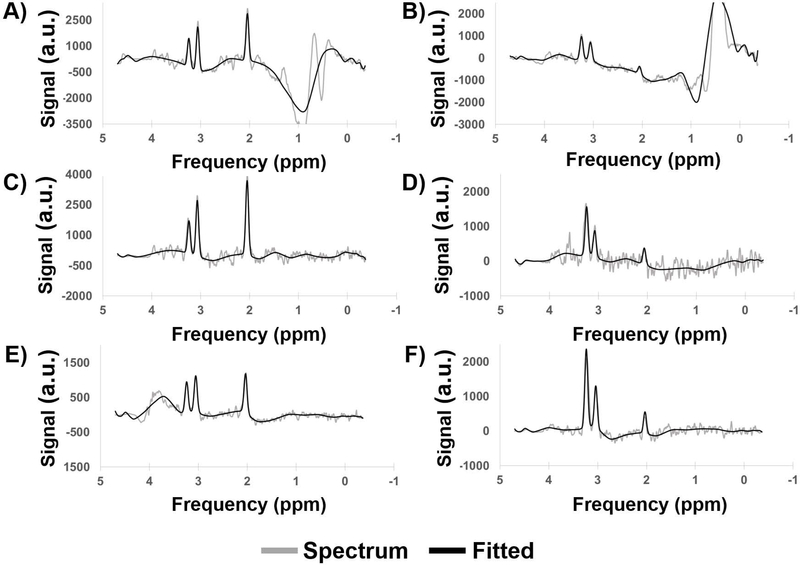
Figure 3.
Sample spectra (real components) from scans of subjects with glioblastoma. Subject 1 (A,B) was scanned at Emory University; subject 2 (C,D) was scanned at the University of Miami; and subject 3 (E,F) was scanned at Johns Hopkins University. Spectra from regions of healthy tissue (A,C,E) and tumor (B,D,F) are shown. a.u. = arbitrary units.

