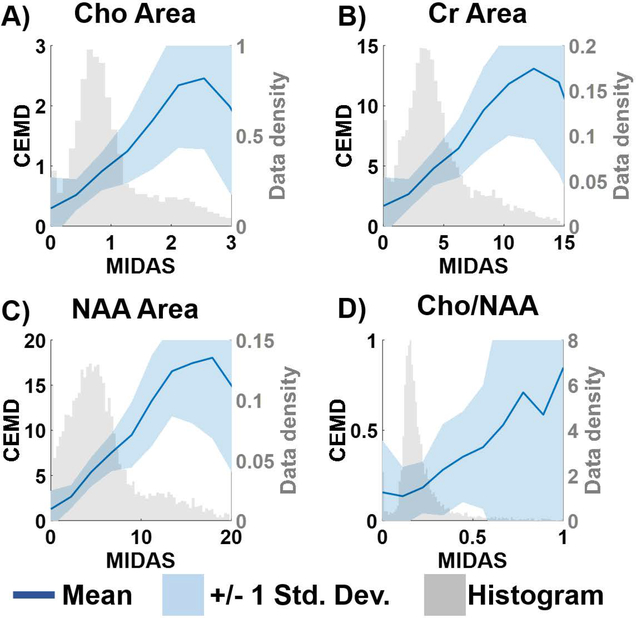
Figure 4.
A comparison of the metabolite values and the Cho/NAA ratio computed by MIDAS and CEMD on the training set of spectra. The gray histogram shows the distribution of MIDAS calculations; the dark blue line indicates the mean values of CEMD and MIDAS in each histogram bin; the shaded blue region indicates the +/− 1 standard deviation of CEMD calculations.

