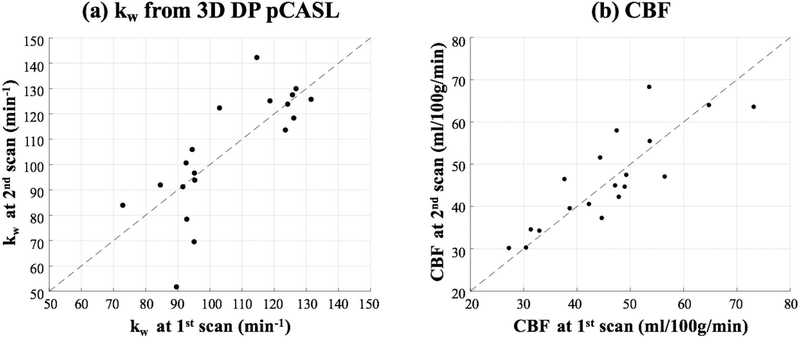
Figure 6.
(a) Average kw values from test-retest experiments using the proposed 3D DP-pCASL sequence. Horizontal and vertical axis indicates the kw measurements from the first and second MRI scan, respectively. (b) Average global CBF values from test-retest experiments. Horizontal and vertical axis indicates the CBF measurements from the first and second MRI scan, respectively.

