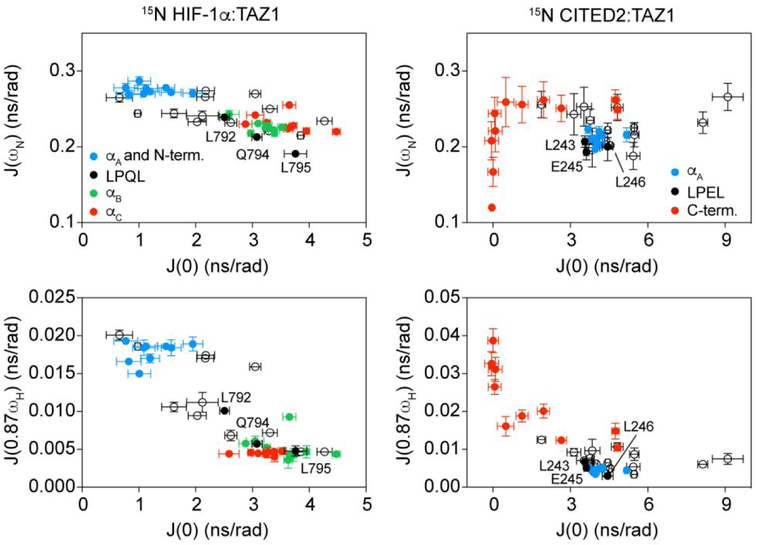
Figure 3.
Evidence for dynamic clustering within binding motifs in 15N HIF-1α:TAZ1 and 15N CITED2:TAZ1. The spectral densities J(ωN) (top) and J(0.87ωH) (bottom) are plotted as a function of J(0) for 15N HIF-1α:TAZ1 (left) and 15N CITED2:TAZ1 (right) for data collected at 600 MHz. Data corresponding to discrete binding motifs of HIF-1α and CITED2 are shown in the colors indicated in the legends. Data points corresponding to the residues in the conserved LP(Q/E)L motif are labeled.

