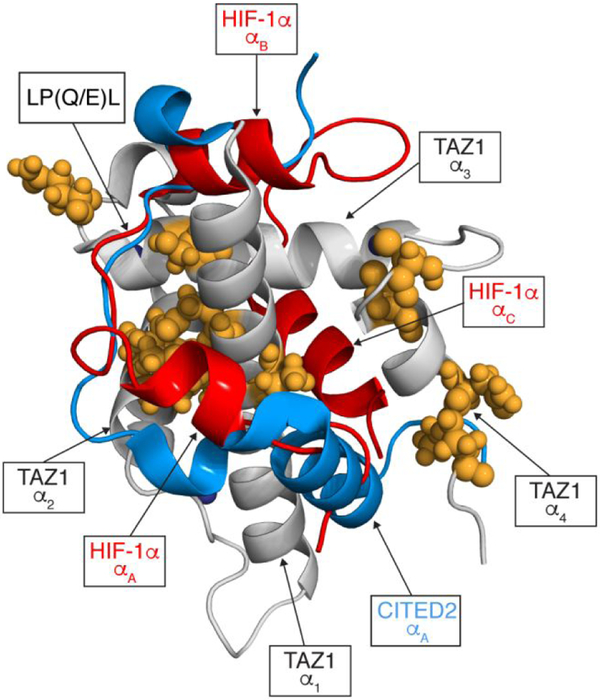
Figure 6.
Mapping changes in 15N TAZ1 backbone amide order parameters between the 15N TAZ1:HIF-1α and 15N TAZ1:CITED2 complexes. TAZ1 is shown in grey, HIF-1α is shown in red, and CITED2 is shown in blue. Zinc atoms are shown as dark blue spheres. Residues with ΔS2 greater than 0.1 are shown as orange spheres. The ΔS2 values were calculated as S2CITED2 - S2HIF1α. The secondary structural elements of HIF-1α and CITED2, the conserved LP(Q/E)L motif, and the TAZ1 helices are labeled for reference. The disordered C-terminal tail of CITED2 (residues 260-269) is not shown.

