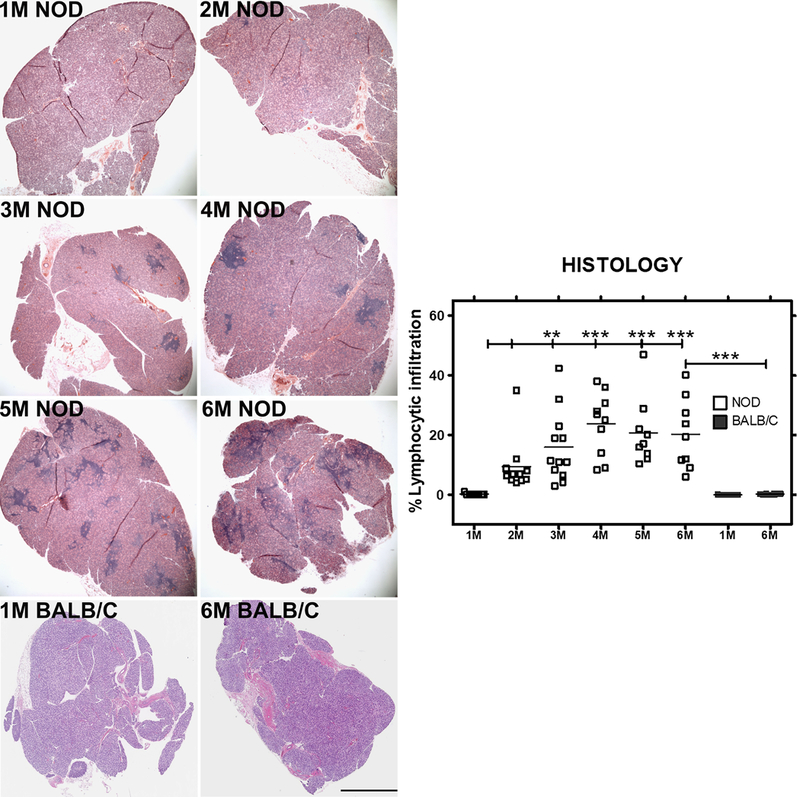
Fig 1: Representative images and quantitative assessment of lymphocytic infiltration in LG of male NOD and BALB/c mice.

1 to 6 M old male NOD mice and 1 and 6M old male BALB/c (n=9–12 mice per group) LGs were sectioned and stained with H&E. Images show foci of infiltrating lymphocytes (dark purple patches) within tissue, representing a measure of disease progression over time. Bar, 300 μm. Image J was used to quantify the percentage of lymphocytic infiltration. One-way ANOVA with Tukey’s multiple comparison test was used to for statistical comparison. The overall ANOVA p-value was < 0.0001. * indicates post-test P-values for each of the NOD age groups (2 M, 3 M, 4 M, 5 M, 6 M) compared to NOD at 1 M, and also 6 M NOD compared to 6 M BALB/c. * P<0.05; **, P< 0.01; and *** P < 0.001.
