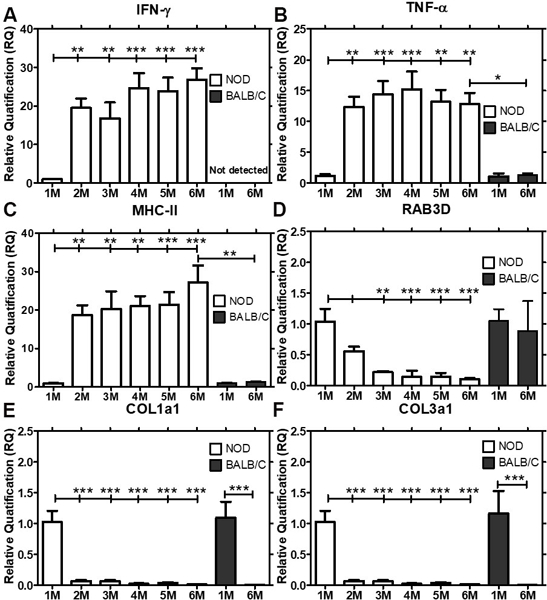
Fig 2: Expression levels of IFN- γ, MHC-II, TNF-α, RAB3D, COL1a1 and COL3a1 in male NOD and BALB/c mouse LG from 1 M through 6 M of age determined by qPCR.

Gene expression of IFN-γ, MHC-II, TNF-α, RAB3D, COL1a1 and COL3a1 were quantified in male NOD mice at 1 M of age, prior to initiation of inflammation of the LG, through 6 M of age (n=7–9 mice per group), when autoimmune dacryoadenitis is established and in BALB/c mice at 1 M and 6 M of age (n=4 mice per group). Data represents Mean ± SEM of relative quantification, which was measured using the formula 2-ΔΔCt. One-way ANOVA followed by Tukey’s multiple comparison test was used for statistical comparison. The overall ANOVA p-values for each of IFN- γ, MHC-II, TNF-α, RAB3D, COL1a1 and COL3a1 was < 0.0001. * indicates post-test p-values for each of the NOD age groups (2 M, 3 M, 4 M, 5 M, 6 M) compared to NOD 1 M, and 6 M NOD compared to 6 M BALB/c. * P<0.05; **, P< 0.01; and *** P < 0.001.
