
Fig 3: Collagen type 1 expression and quantitative analysis in male NOD and BALB/c mice LG visualized by indirect immunofluorescence.
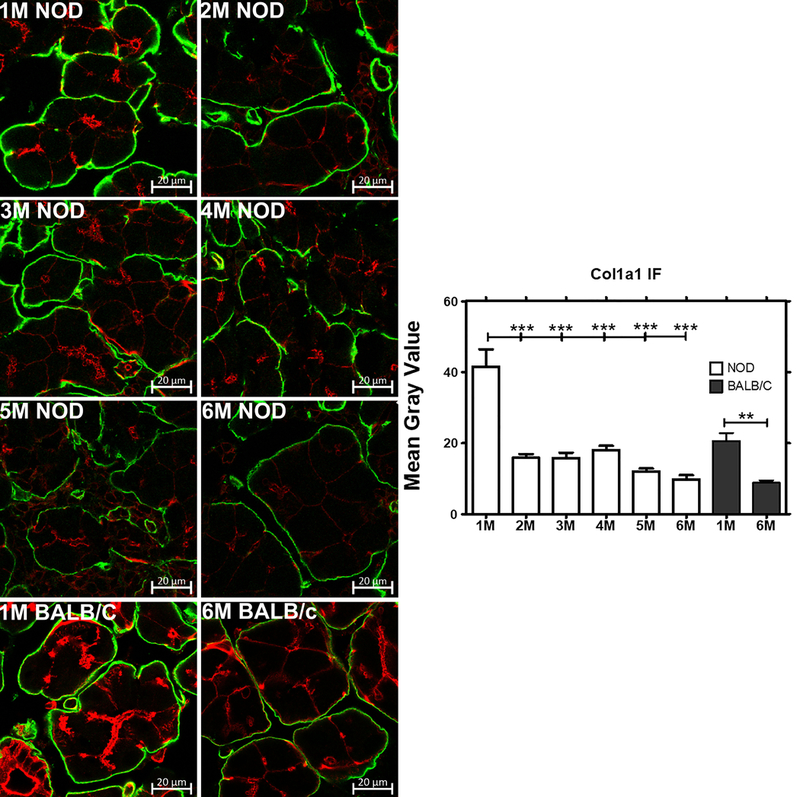
The intensity of Collagen 1 immunofluorescence was clearly decreased from 1–6 M in parallel with the decreased col1a1 gene expression seen in NOD and BALB/c mice LG (n=3 mice per group). Green, collagen 1 visualized with a Rabbit anti-Col1a1 polyclonal antibody and an Alexa Fluor® 488-donkey anti-rabbit secondary antibody; red, actin labeled with rhodamine-phalloidin. Bar, 20 μm. Image J was used to quantify the expression level of Col1a1. One-way ANOVA followed by Tukey’s multiple comparison test was used for statistical comparison. The overall ANOVA p-value was < 0.0001. * indicates post-test p-values for each of the NOD age groups (2 M, 3 M, 4 M, 5 M, 6 M) compared to NOD 1 M, and 6 M BALB/c compared to 1M BALB/c. * P<0.05; **P< 0.01; and *** P < 0.001.