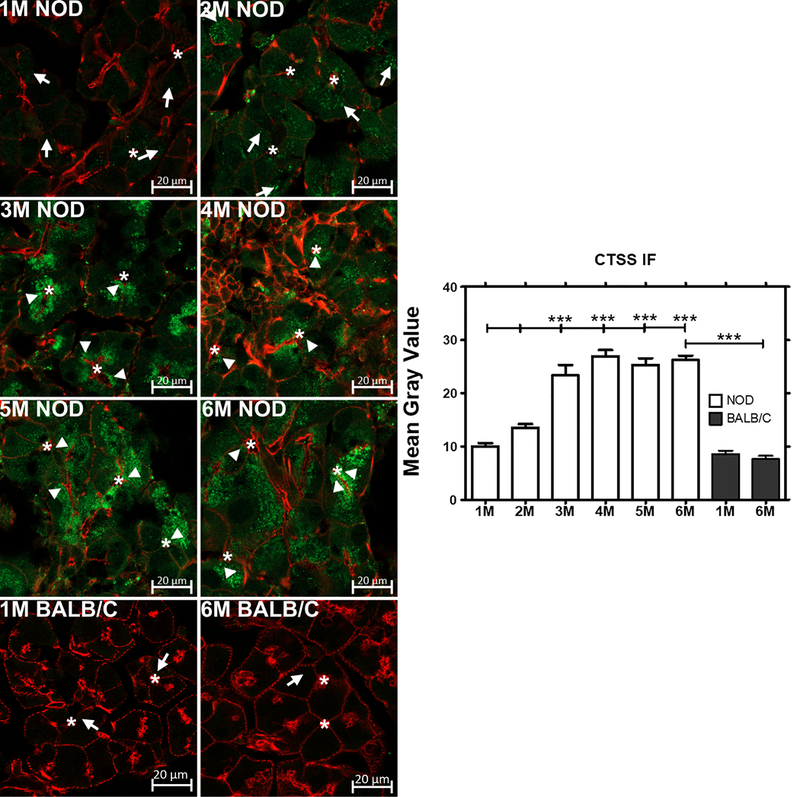
Fig 5: Expression and quantification of CTSS immunofluorescence in male NOD and BALB/c mouse LG from 1 M thorough 6 M.

CTSS showed increased immunofluorescence consistent with its increased gene expression. In addition, its distribution shifted from enrichment in apparent basolateral lysosomes (arrows) to apparent secretory vesicles located beneath the apical plasma membrane (arrowheads). CTSS immunofluorescence was not abundant in both 1 and 6 M old male BALB/c mice LG (n=3 mice per group). *, luminal regions and Bars, 20 μm. Green, CTSS immunofluorescence obtained with a rabbit anti-CTSS polyclonal antibody and Alexa Fluor® 488-donkey anti-rabbit secondary antibody. Red, actin filaments labeled with rhodamine-phalloidin. Image J was used to quantify the expression of CTSS in NOD and BALB/c mice acini. One-way ANOVA followed by Tukey’s multiple comparison test was used for statistical comparison. The overall ANOVA p-value was < 0.0001. * indicates post-test p-values for each of the NOD age groups (2 M, 3 M, 4 M, 5 M, 6 M) compared to NOD 1 M, and 6 M NOD compared to 6 M BALB/c. * P<0.05; **P< 0.01; and *** P < 0.001.
