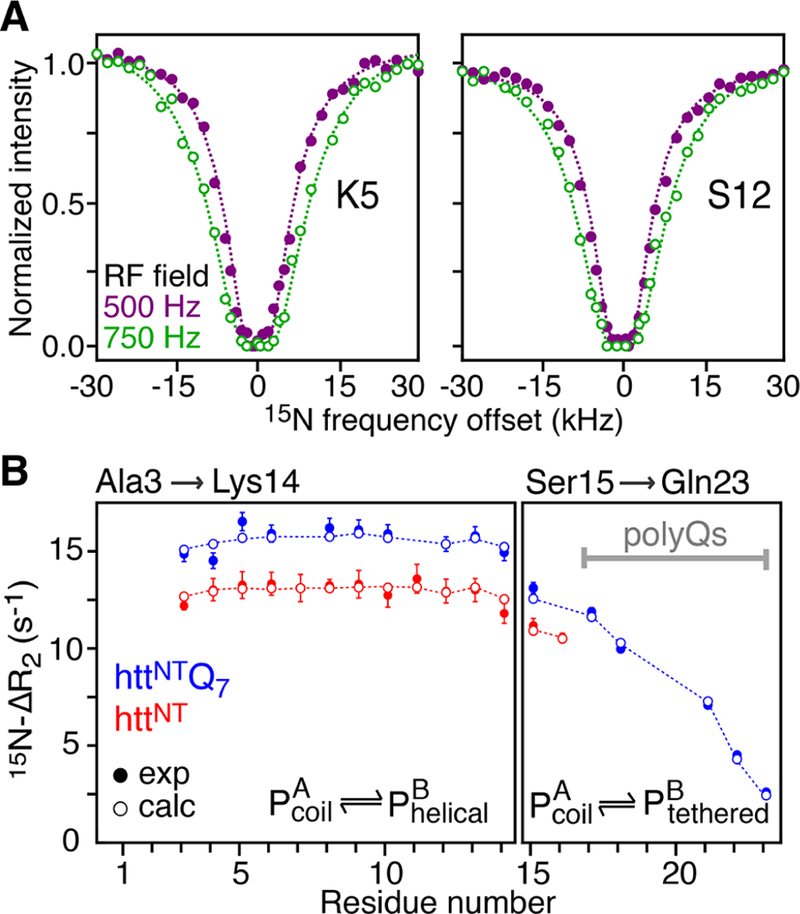
Figure 1.

Binding of httNT and httNTQ7 to SUVs characterized by relaxation-based NMR experiments. (A) Examples of 15N-DEST profiles acquired on Lys5 and Ser12 of httNT in the presence of SUVs at RF field strengths of 500 and 750 Hz shown as filled-in purple and open green circles, respectively. (B) 15N-ΔR2 profiles for httNT and httNTQ7 in the presence of SUVs. Experimental data are shown as red and blue filled-in circles for httNT and httNTQ7, respectively. Dashed lines in (A) and open circles in (B) represent best-fits of the 15N-DEST and 15N-ΔR2 data to a two-state exchange model. Residues that do not fit well to this model and required a separate treatment (see text) are shown in the right panel. The data were recorded at 600 MHz and 10 °C on a 300 μM peptide sample in the presence of SUVs at a 1:4 molar ratio of peptide to lipid (on a lipid molecule basis).
