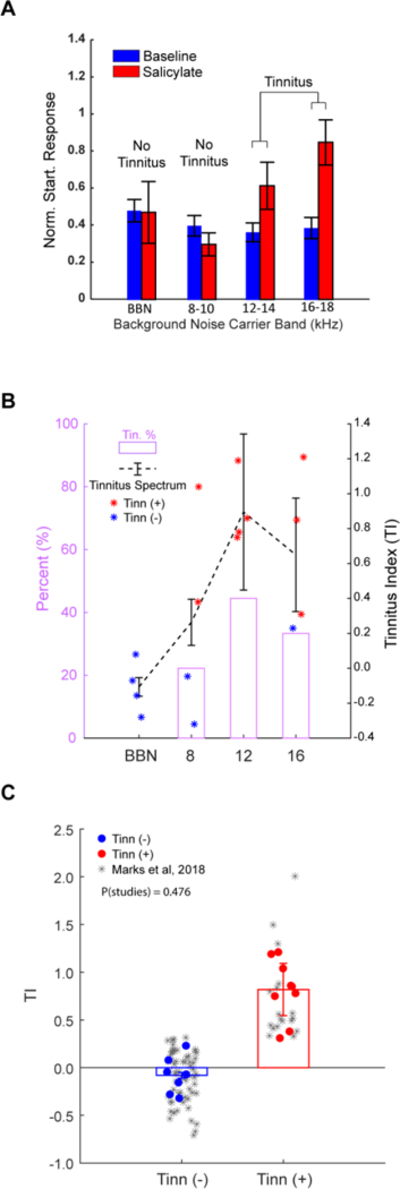
Figure 2. GPIAS identifies guinea pigs with tinnitus after salicylate.

A) An example animal shows significantly increased normalized startle response ratios in the 12–14 and 16–18 kHz noise bands after receiving salicylate (red) compared to baseline (blue), but not in the BBN and 8–10 kHz bands. B) The left axis shows the percentage of animals within having tinnitus within the band (pink), while the right axis shows the average tinnitus spectrum (dashed black lines; data are mean+/−SEM). C) Pooled Tis from all tested animals for within tinnitus frequency bands (red) and outside tinnitus frequency bands (blue) are not significantly different compared to TI distributions from Marks et al. (2018). Data shown are mean+/−SEM. Significance assessed using two-way ANOVA. Alpha = 0.05.
