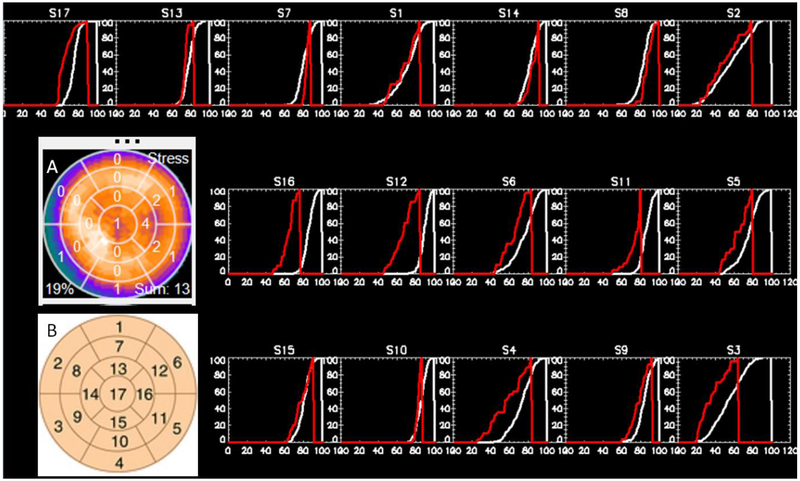
Figure 1. 17-Segment Results from a Patient with LCx vessel disease.
Color polar map insert (A) shows the myocardial perfusion distribution for a female patient with LCx vessel disease with the 17-segment model with scores superimposed. The 17 plots correspond to the 17-segment model (B) with the LAD segments on the top, LCX in the middle, and RCA in the bottom rows. The x-axes are the normalized count values and the y-axes are the normalized voxel frequencies with those count values. The white distributions are the averaged normalized cumulative distributions from 20 female patients with low likelihood of CAD. The red distributions are the normalized cumulative count value distributions for the patient shown in the polar map. Note that red distributions to the left of the white normal ones represent increasing certainty of abnormality. Also note how well behaved is the shape of each of the patient’s segmental distributions even though it represents a small portion of the LV from just one patient.

