
Fig. 10.
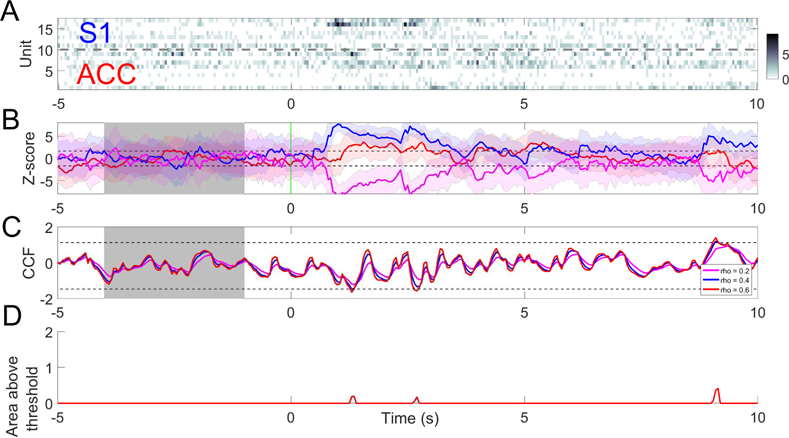
(A) A trial example of rat ACC and S1 population spike count observations with 50 mW laser stimulation at time 0. (B) Z-score curves derived from ACC (green), S1 (blue) and their merged activity (magenta). Horizontal dashed lines denote the ±1.65 threshold. (C) Z-scored CCF derived from both regions based on different values of the forgetting factor ρ; m = n = 0.5. Horizontal dashed lines indicate the mean±3SD threshold computed from the CCF during baseline (shaded area). (D) Tracking the area of CCF curve above the mean±3SD threshold in panel C (ρ = 0.6).