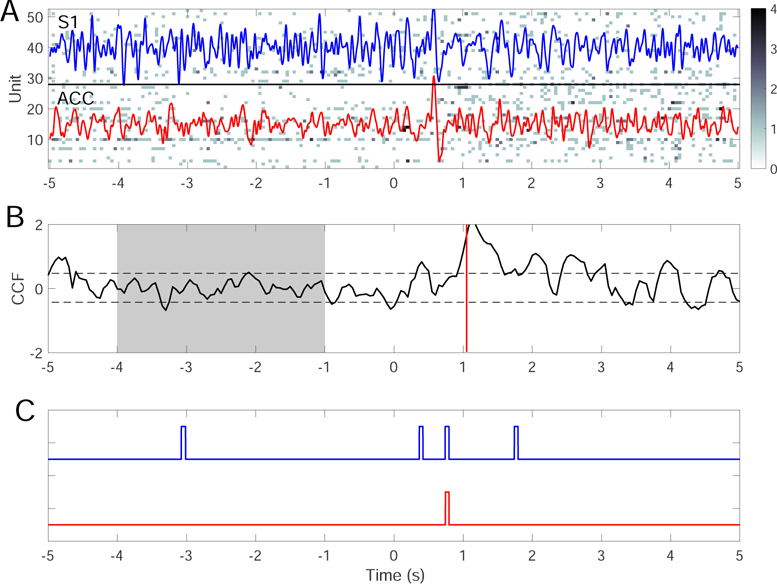
Fig. 12.

A single-trial example of ensemble detection based on simultaneous ACC and S1 recordings. (A) population spike count observations with 250 mW laser stimulation at time 0. The band-passed (2–20 Hz) LFP traces from the ACC (red) and S1 (blue) are overlaid over the ensemble spike count observations. (B) Z-scored cross-correlation function (CCF) based on single models derived from the previous one trial. ρ = 0.6, m = n = 0.5. Horizontal dashed lines indicate the mean±3SD threshold. Shaded area represents the baseline. Vertical line (∼ 1 s) indicates the time of detection upon reaching the area threshold. (C) Pain-evoked ERP detection using the SVM for the ACC (red) and S1 (blue) areas. Based on the majority vote, the detection latency of pain signals is around 800 ms
