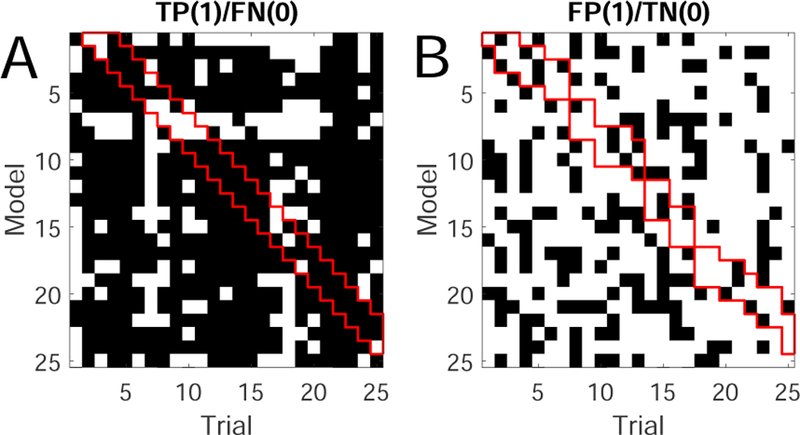
Fig. 2.

(A) Detection results of the true positive (TP) matrix. Each entry of the matrix denote the detection re-sult from one model (row) applied to one trial (column). Black/white color denotes TP/FN. (B) Detection results of the false positive (FP) matrix. Black/white color denotes FP/TN. In both panels, the red banded diagonal marks the results using models trained from previous 3 trials.
