Fig. 5.

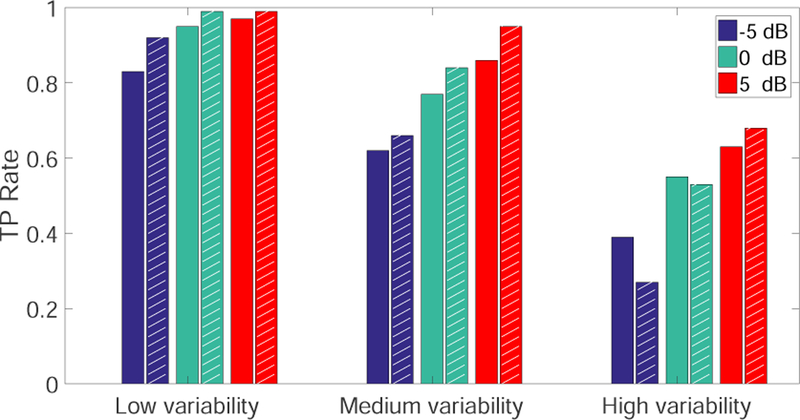
Comparison of the average TP rate between the single model detector and ECPDs (shaded bars) under different SNR levels and trial-by-trial variabilities (computer simulation setup 1).

Comparison of the average TP rate between the single model detector and ECPDs (shaded bars) under different SNR levels and trial-by-trial variabilities (computer simulation setup 1).