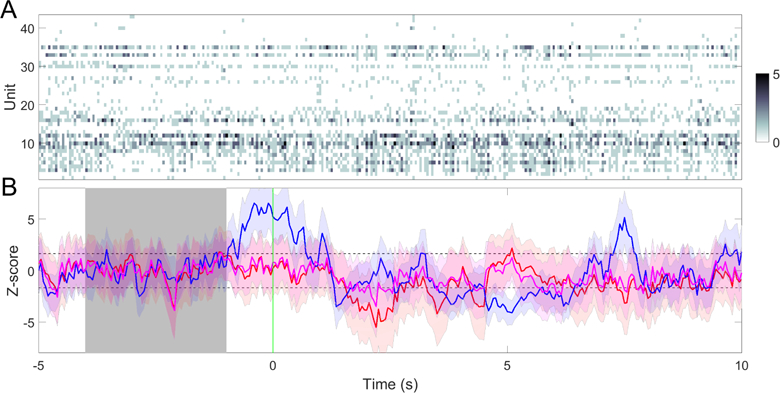
Fig. 8.

(A) A trial example of spike count observations from C = 43 S1 units (session 3). Time 0 denotes the onset of 50 mW laser stimulation. (B) Z-score statistics derived from PLDS models trained with 3 preceding trials. Model trained from the preceding trials (n − 1, red; n − 2, blue; n − 3, magenta). In this example, 1 out of 3 models detects FP. Shaded area denotes the baseline period ([−4, −1] s) for computing the Z-score. Horizontal dashed lines denote the ±1.65 threshold.
