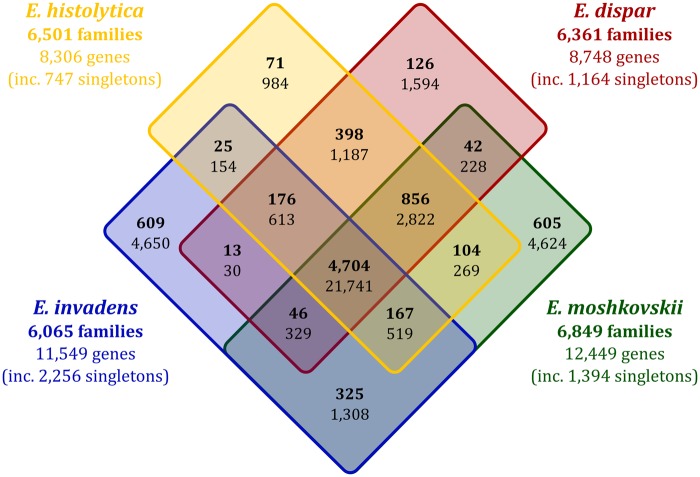
Fig. 2.
—Venn diagram showing numbers of unique and orthologous genes and families in the genomes of Entamoeba histolytica, Entamoeba dispar, Entamoeba invadens, and Entamoeba moshkovskii. Numbers are based upon OrthoMCL output. Numbers in bold represent gene families; accompanying numbers in regular font represent the number of genes comprising those gene families.

